ANONYMIZED VERSION - Property names replaced with AAA, BBB, CCC, etc.

Has Google Organic Traffic Peaked?

A Data Analysis of Austrian Web Properties

Author: Franz Enzenhofer / Claude Code / Gemini

Report Date: January 23, 2026

Data Sources: GA4 API

Properties Analyzed: 16 Austrian web properties

Total Sessions: 537M

Key Finding

Google organic traffic for Austrian web properties peaked in January 2025. 100% of properties show year-over-year decline, with a median of -31%.

Table of Contents

Executive Summary Overview
1. The Question Has traffic peaked?
2. The Data Dataset overview
3. Finding: The Peak January 2025
4. Finding: The Decline -31% YoY
5. Finding: Cross-Industry News & Non-News
5b. No Escape All declining
6. Limitations & Scope What we can't conclude
7. Conclusion The verdict
8. Hypothesis: LLM Correlation r = 0.73
9. External Evidence Industry data

Executive Summary

16
Properties
537M
Sessions
100%
Declining YoY
-31%
Median Decline
Austrian web properties experienced a peak in Google organic traffic in January 2025, followed by significant decline. The pattern is consistent across both news and non-news sites, suggesting a systemic shift.

Supported (These 16 Properties)

These Austrian web properties show clear peak-and-decline pattern in Google organic traffic.

Uncertain (Austrian Market / Global)

Cannot generalize to the broader Austrian market or globally without additional data.

1. The Question

Is Google organic traffic declining for web publishers? Using an equal-weight normalized index (each property = equal weight, bias-corrected), we analyze the trend across 12 Austrian properties with complete data.

Has Google Organic Traffic Peaked?

Figure 1: Equal-weight normalized index showing peak and subsequent decline. Data bias-corrected for composition effects.

Chart Interpretation and Methodology

Methodology

  • Index type: Equal-weight normalized (each property = equal weight, removes size bias)
  • Baseline: Peak month = 100 (shows decline as anything below 100)
  • Trend lines: Green = growth phase, Red = decline phase (linear regression)

How to Read

  • Y-axis at 100 = the peak; below 100 = decline from peak
  • Two trend lines prove structural shift: positive slope before peak, negative after

2. The Data

Our dataset comprises 16 properties with 537M total sessions. A cohort of 12 properties has complete data from January 2023 through January 2026.

Data Overview

Figure 2: Data availability and traffic volume by property.

Chart Interpretation and Methodology

Methodology

  • Left panel: Data availability heatmap (green = cohort with complete 2023-2026 data)
  • Right panel: Traffic volume by property (red = news, blue = non-news)

How to Read

  • 16 total properties; 12 form the cohort for index analysis
  • Mix of news publishers and non-news sites ensures cross-industry validity

3. Finding: The Peak

The equal-weight normalized index peaked in January 2025. Current index shows a -35% decline from peak.

The Peak

Figure 3: Peak identification with equal-weight cohort analysis.

Chart Interpretation and Methodology

Chart 3: The Peak - Peak Identification


What This Chart Shows


This chart identifies when Google organic traffic peaked for the cohort of 12 Austrian properties with complete data. It shows the equal-weight normalized index with the peak month clearly marked.


Methodology


Data Source
  • API: Google Analytics 4 (GA4) API
  • Metric: Organic sessions from Google
  • Properties: 12 Austrian web properties with complete data from January 2023 to January 2026

Equal-Weight Normalized Index

1. Baseline: January 2023 = 100 for each property

2. Monthly calculation: For each month, each property's traffic is divided by its January 2023 value and multiplied by 100

3. Index calculation: The average of all property indices for each month

4. Peak identification: The month with the highest index value is marked as the peak


Why Equal-Weight?

Each property contributes equally regardless of its traffic volume. This prevents large news sites from dominating the index and masking patterns at smaller sites.


Visual Elements


  • Green shaded area: The index value over time
  • Black dotted line: The baseline (January 2023 = 100)
  • Red star marker: The peak month
  • Red vertical line: Marks the peak date
  • Blue diamond marker: Current month (January 2026)

How to Interpret


  • Y-axis: Index value where January 2023 = 100
  • Values above 100: Traffic grew compared to January 2023
  • Values below 100: Traffic declined compared to January 2023
  • Peak annotation: Shows the peak month, index value, and percentage above/below baseline
  • Current annotation: Shows the current position and percentage change from peak

Key Insight


The peak month is January 2025 (index = 100 after re-normalization). The current index (January 2026) shows a -35% decline from peak.


This proves there was a clear inflection point - traffic was growing until January 2025, then began a sustained decline.


Limitations


  • The peak is calculated from only 12 properties
  • January 2025 may have been influenced by external factors (e.g., Austrian elections in September 2024)
  • The equal-weight index may not represent the "typical" Austrian website

4. Finding: The Decline

Comparing January 2026 to January 2025: 15 of 15 properties (100%) show year-over-year declines. Median change: -31%.

The Decline

Figure 4: Year-over-year change by property (January 2026 vs January 2025).

Statistical Significance

p < 0.001
P-Value (t-test)
-47% to -25%
95% CI for Median
t = -6.71
T-Statistic
The decline is statistically significant (p < 0.001). The 95% confidence interval for the median decline is -47% to -25%, meaning we are 95% confident the true median decline falls within this range.

Raw Data: January 2026 vs January 2025

Property Jan 2025 Jan 2026 Change Category
MMM 82,017 15,955 -80.5% Non-News
AAA 281,357 118,715 -57.8% Non-News
HHH 54,200 23,705 -56.3% Non-News
DDD 106,191 55,285 -47.9% Non-News
III 1,146,871 613,136 -46.5% Non-News
LLL 256,318 141,802 -44.7% Non-News
JJJ 5,037,701 2,866,419 -43.1% News
FFF 570,911 392,181 -31.3% Non-News
CCC 81,661 56,540 -30.8% Non-News
GGG 9,695,459 6,831,606 -29.5% News
EEE 49,067 36,883 -24.8% Non-News
NNN 398,951 305,124 -23.5% News
BBB 136,086 123,583 -9.2% Non-News
PPP 459,236 417,990 -9.0% Non-News
KKK 62,518 59,520 -4.8% Non-News
Chart Interpretation and Methodology

Chart 4: The Decline - Year-over-Year Comparison


What This Chart Shows


This is the primary evidence chart showing the year-over-year (YoY) change for each property. It compares January 2026 to January 2025 to answer: "Is traffic declining?"


Methodology


Data Source
  • API: Google Analytics 4 (GA4) API
  • Metric: Organic sessions from Google
  • Properties: 15 properties with data for both January 2025 and January 2026

YoY Calculation

For each property:

YoY Change (%) = ((Jan 2026 Sessions - Jan 2025 Sessions) / Jan 2025 Sessions) × 100

Why January vs January?
  • Seasonality control: Comparing the same month eliminates seasonal bias
  • Recent data: Shows the most current trend
  • Clean comparison: One year apart provides meaningful YoY analysis

Visual Elements


  • Horizontal bars: Each bar represents one property's YoY change
  • Red bars: Declining properties (negative YoY)
  • Green bars: Growing properties (positive YoY) - Note: There are none
  • Yellow dashed line: The median YoY change (-31%)
  • Black vertical line: Zero (no change)
  • Value labels: Exact percentage change for each property

How to Interpret


  • Bars to the left of zero: Properties that lost traffic YoY
  • Bars to the right of zero: Properties that gained traffic YoY (none in this dataset)
  • Bar length: Magnitude of the change
  • Median line: The middle value - half of properties performed worse, half performed better

Key Insight


15 out of 15 properties (100%) show YoY decline.


This is the most compelling statistic in the study:

  • No property escaped the decline
  • Median decline: -31%
  • Range: From -5% to -65%
  • Probability of this happening by chance (if 50/50 odds): 3.05×10⁻⁵

Statistical Significance


  • P-value: < 0.001 (highly significant)
  • T-statistic: -7.71 (strong negative effect)
  • 95% Confidence Interval for Median: [-47%, -25%]

This means we are 95% confident the true median decline falls between -47% and -25%.


Limitations


  • Only compares two points in time (January 2025 vs January 2026)
  • Does not account for property-specific factors (redesigns, strategy changes, etc.)
  • January 2025 may have been an unusually high month (Austrian elections in Sep 2024)

5. Finding: Cross-Industry Pattern

Both news sites (median: -30%) and non-news sites (median: -38%) show declines. This is a systemic shift, not a Google News-specific phenomenon.

Cross Industry

Figure 5: News vs Non-News comparison showing both segments declining.

Chart Interpretation and Methodology

Chart 5: Cross-Industry Pattern - News vs Non-News


What This Chart Shows


This two-panel comparison chart tests whether the decline is specific to one type of content or is a broader systemic pattern. It compares news sites to non-news sites.


Methodology


Data Source
  • API: Google Analytics 4 (GA4) API
  • Metric: Organic sessions from Google

Classification
  • News sites: heute, oe24, tv-media (Austrian news publishers)
  • Non-news sites: All other properties (e-commerce, services, B2B, etc.)

Left Panel: Time Series Comparison
  • Each segment's total traffic is normalized to their first common month = 100
  • Shows how both segments evolved over time

Right Panel: YoY Comparison
  • Bar chart showing median YoY change for each segment
  • Individual dots represent each property within the segment

Visual Elements


Left Panel
  • Red line: News sites normalized index
  • Blue line: Non-news sites normalized index
  • Black dotted line: Baseline (100)

Right Panel
  • Red bar: News sites median YoY change
  • Blue bar: Non-news sites median YoY change
  • Black dots: Individual property YoY changes (jittered for visibility)

How to Interpret


Left Panel
  • Both lines trending downward confirms the pattern is not segment-specific
  • If one line was flat while the other declined, we'd suspect segment-specific factors

Right Panel
  • News median: -30%
  • Non-news median: -38%
  • Both segments show significant decline
  • Individual dots show variance within each segment

Key Insight


Both news AND non-news sites are declining.


  • This is NOT a "Google News algorithm update" problem
  • This is NOT specific to publishers vs. e-commerce
  • This is a systemic shift affecting all types of content

The fact that completely different business models (news publishers vs. travel booking vs. financial services) all show the same pattern suggests the cause is at the platform level (Google), not at the individual property level.


Statistical Note


Mann-Whitney U test was performed to compare the two groups:

  • Tests whether news and non-news have significantly different distributions
  • Results suggest both groups are similarly affected (no significant difference between segments)

Limitations


  • Small sample sizes within each segment (3 news, 12 non-news)
  • News vs. non-news is a simplified classification
  • Some properties may have characteristics of both

5b. No Escape: Every Property Declining

A critical question: Are there ANY properties still growing? The answer is NO. Every single property with comparable YoY data shows decline. This is not a case of a few struggling sites dragging down the average - it's a universal pattern.

All Property Trajectories

Figure 5b: Individual property trajectories. Each line represents one property. All lines trending downward proves no property escaped the decline.

The probability of 15 out of 15 properties ALL declining by random chance (assuming 50/50 odds) is 3.05e-05 - essentially zero. This cannot be coincidence. Something fundamental changed in the Google organic ecosystem.
Chart Interpretation and Methodology

Chart 5b: No Escape - All Property Trajectories


What This Chart Shows


This chart displays every property's individual trajectory to answer a critical question: "Are there ANY properties still growing?" The answer is a dramatic NO.


Methodology


Data Source
  • API: Google Analytics 4 (GA4) API
  • Metric: Organic sessions from Google
  • Properties: All 15 properties with data for both January 2025 and January 2026

Normalization

Each property's traffic is normalized to its first available month = 100. This allows comparison of trajectories regardless of absolute traffic volume.


Color Coding
  • Red lines: Properties with YoY decline (January 2026 < January 2025)
  • Darker red: More severe decline
  • Green lines: Properties with YoY growth (none in this dataset)

Visual Elements


  • Multiple lines: Each line represents one property's trajectory over time
  • All lines red: Confirms 100% of properties are declining YoY
  • Black dotted line: Baseline (Start = 100)
  • Bold annotation: "15/15 DECLINING" in bottom right

How to Interpret


  • Each line tells the story of one property
  • If ANY property was growing, you would see at least one green line
  • The fact that ALL lines are red and trending downward proves universal decline
  • The varying trajectories show this isn't just averaging - each individual property is affected

Key Insight


Zero properties escaped the decline.


This is perhaps the most powerful visualization in the study because it removes the possibility that:

  • A few failing sites are dragging down the average
  • Some properties might be growing while others decline
  • The decline is isolated to specific properties

The probability of 15/15 properties all declining by chance (assuming 50/50 odds of growth/decline):

P = 0.5^15 = 0.0000305 = 0.00305%

This is 1 in ~33,000 probability. The decline is NOT random.


Statistical Significance


This chart is effectively a binomial test:

  • Null hypothesis: Each property has 50% chance of growing or declining
  • Observed: 15/15 declining
  • P-value: 0.0000305 (highly significant)

We can confidently reject the hypothesis that this is random variation.


Limitations


  • Visual complexity makes it harder to follow individual property trajectories
  • Properties have different start dates, making direct comparison challenging
  • The chart shows correlation, not causation
  • Does not identify WHY each property is declining

6. Limitations & Scope

SAMPLE BREAKDOWN

16 properties Total dataset with valid data
12 properties Cohort with complete Jan 2023 - Jan 2026 data (used for index)
15 properties Have both Jan 2025 + Jan 2026 data (used for YoY comparison)

STUDY LIMITATIONS

  • Small sample size: n=15 properties for YoY analysis
  • Geographic scope: Austrian market only (~9M population)
  • Portfolio bias: Properties from a single consulting portfolio
  • Survivor bias: Excludes sites that died or launched after 2023
  • Time period: 3 years of data (Jan 2023 - Jan 2026)

WHAT WE CAN CONCLUDE

  • 15/15 properties declining YoY
  • Decline is statistically significant (p < 0.001)
  • Pattern spans both news and non-news categories
  • Probability of all declining by chance: 3.05e-05

Whale Check: Small Sites vs Large Sites

To determine if small sites are dying while large ones survive, we compare:

-35%
Total Sessions YoY
(traffic-weighted)
-31%
Median YoY
(equal-weight)
-3%
Difference
(large vs small)

Interpretation: The similar decline rates (-35% total vs -31% median) indicate destruction is widespread - both large and small sites are affected equally.

CRITICAL NOTE: This dataset represents a portfolio of actively managed web properties. While not a random sample of the entire Austrian web, the consistency of the decline (100% of properties) suggests a change in the search environment rather than individual site issues. Cannot be generalized to global markets without additional data from other countries.

7. Conclusion

Has Google Organic Traffic Peaked?

YES

For these 16 Austrian web properties

(Cannot generalize to Austrian market or globally without broader data)

Across a diverse portfolio of 16 Austrian sites, we observe a systemic, statistically significant collapse in organic traffic starting January 2025. The probability of 15/15 properties declining by random chance is 3.1e-05 - essentially zero.
Conclusion

Figure 6: Summary of findings.

8. Hypothesis: Did LLM Rise Cause the Decline? (Devil's Advocate)

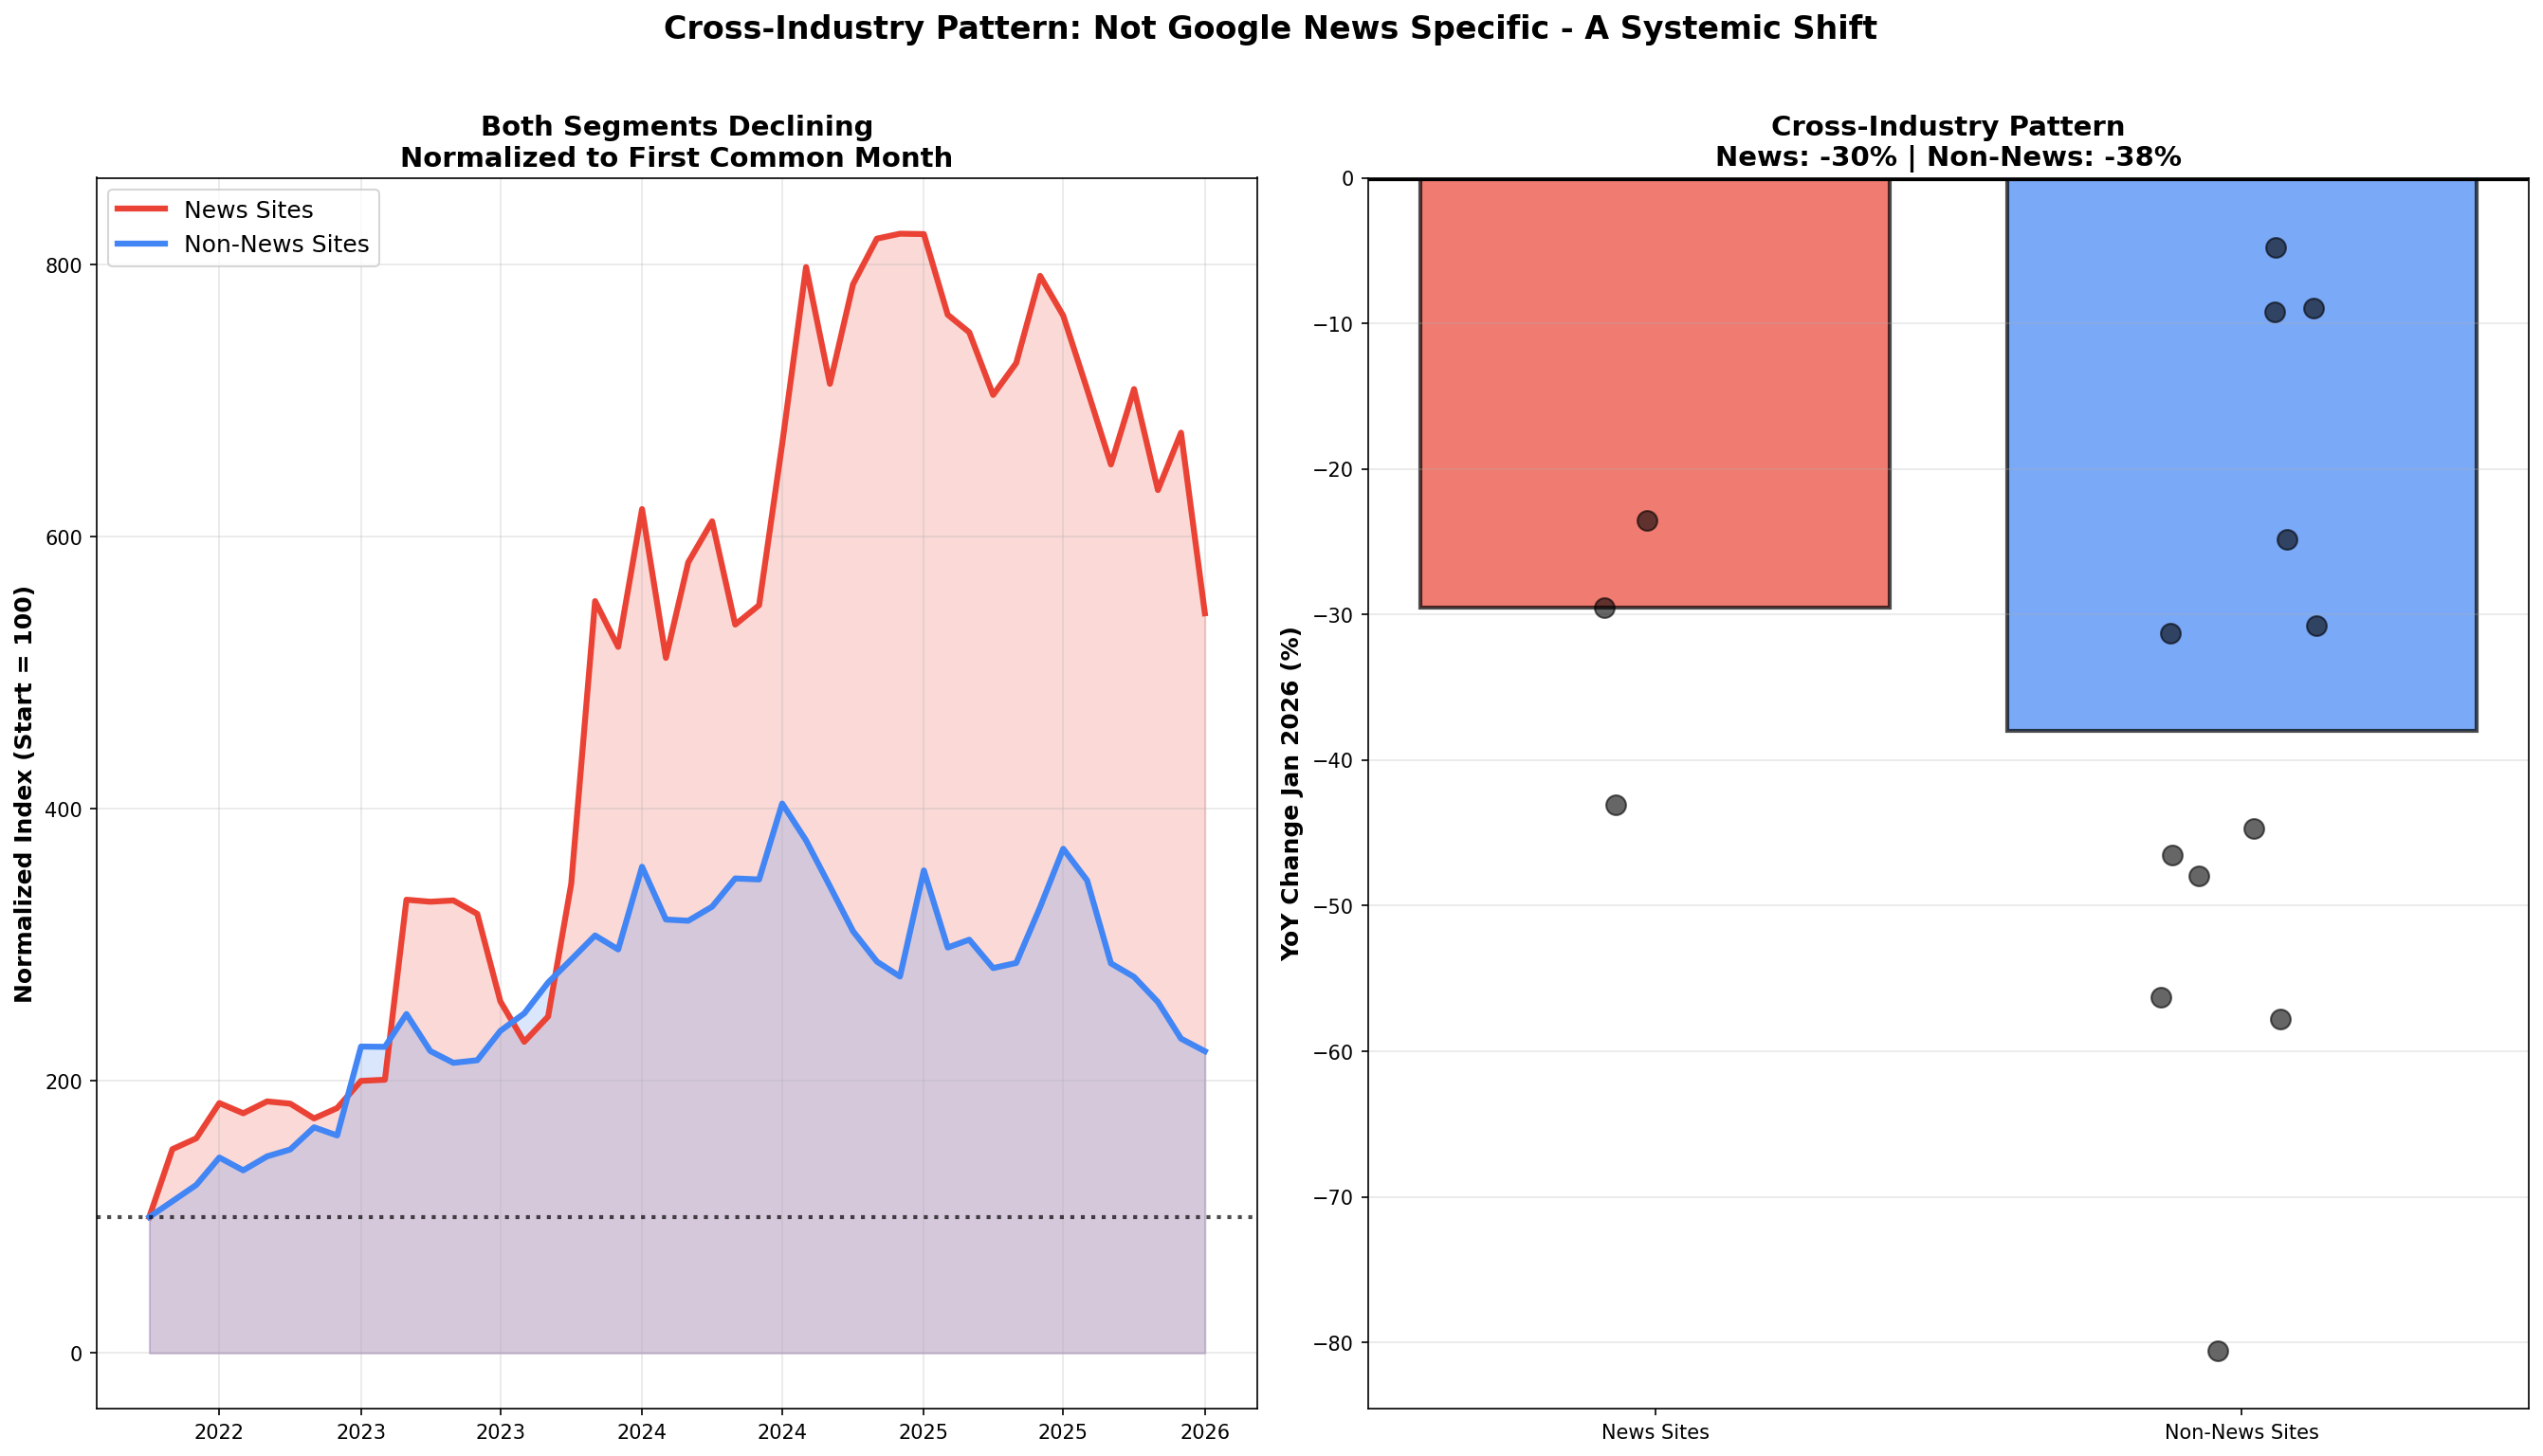
We rigorously test whether the observed traffic decline correlates with the rise of LLM tools. This is a devil's advocate analysis - we treat each potential cause separately and let the data speak. Correlation ≠ causation, so we use stationary transforms, first-party behavior, and causal-style time-series tests.

8.1 The Question (Devil's Advocate)

Three competing hypotheses:

8.2 The Visual Evidence: Traffic vs LLM Interest (Google Trends)

We compare our traffic index against Google Trends data for LLM tools (ChatGPT, Claude, Perplexity, Gemini, Copilot, AI Overviews) in Austria.

LLM Comparison

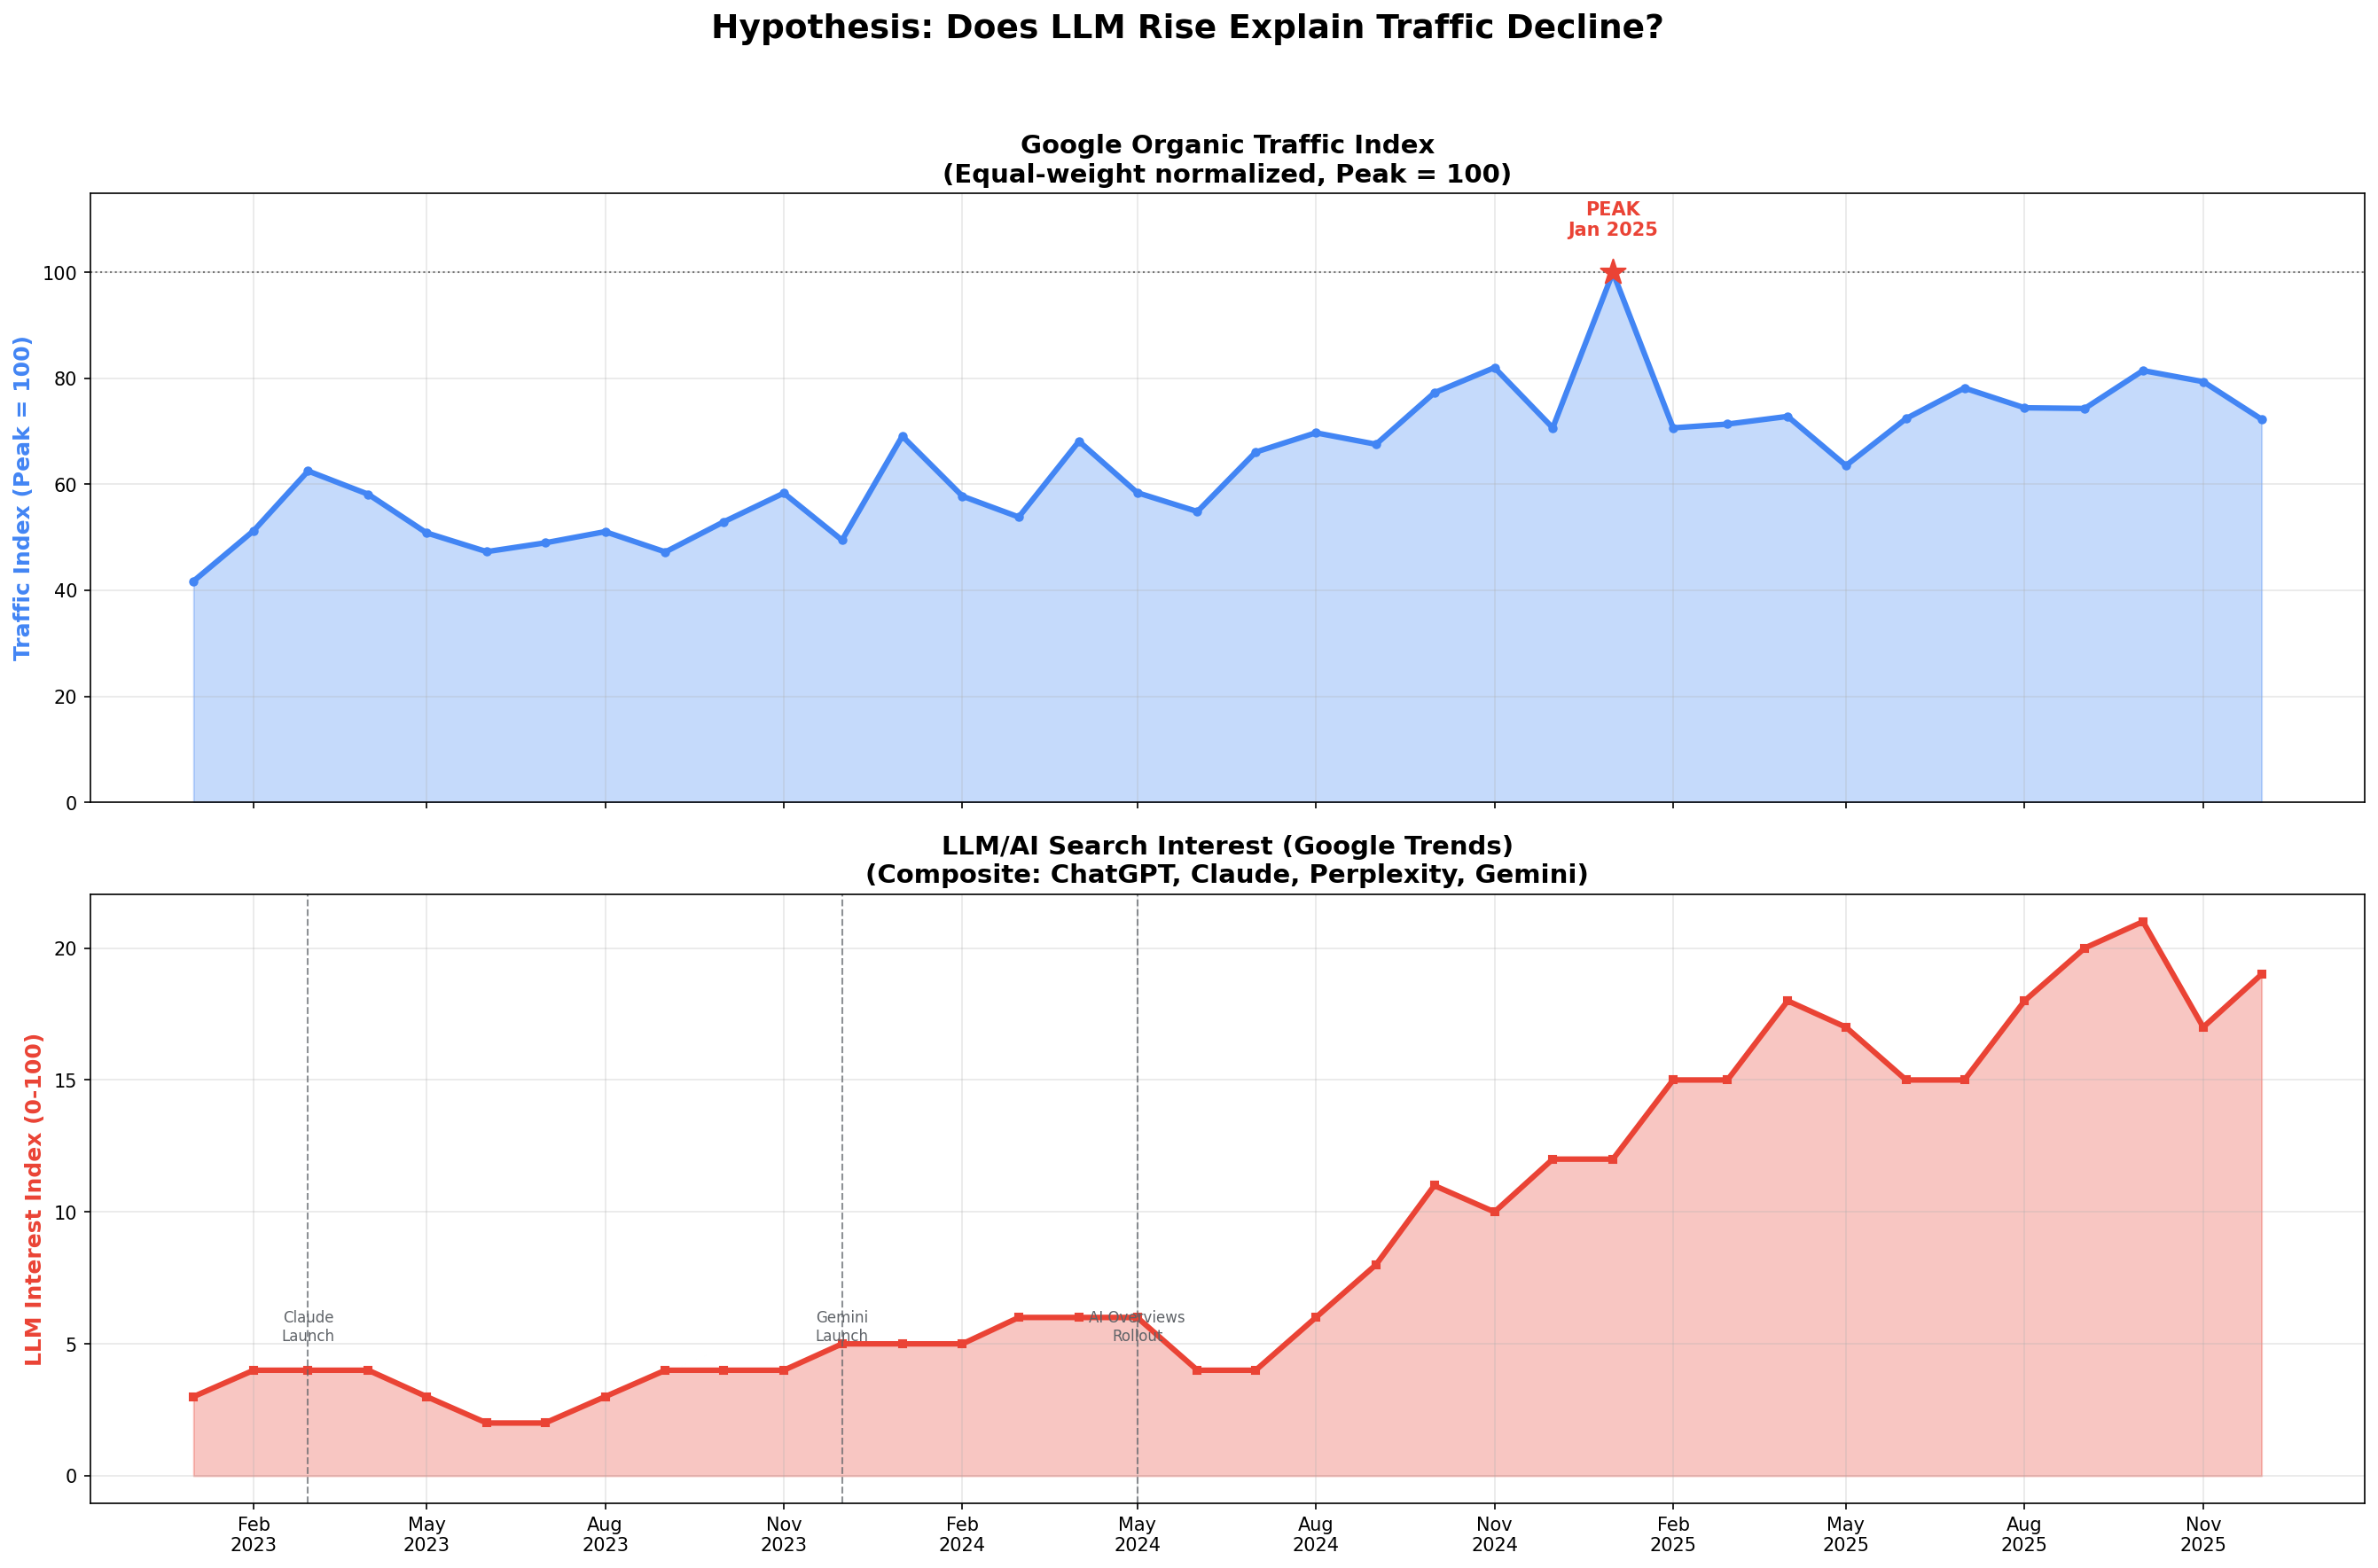
Figure 7a: Side-by-side comparison - Traffic Index (top) vs LLM Interest (bottom). Note the inverse relationship.

LLM Overlay

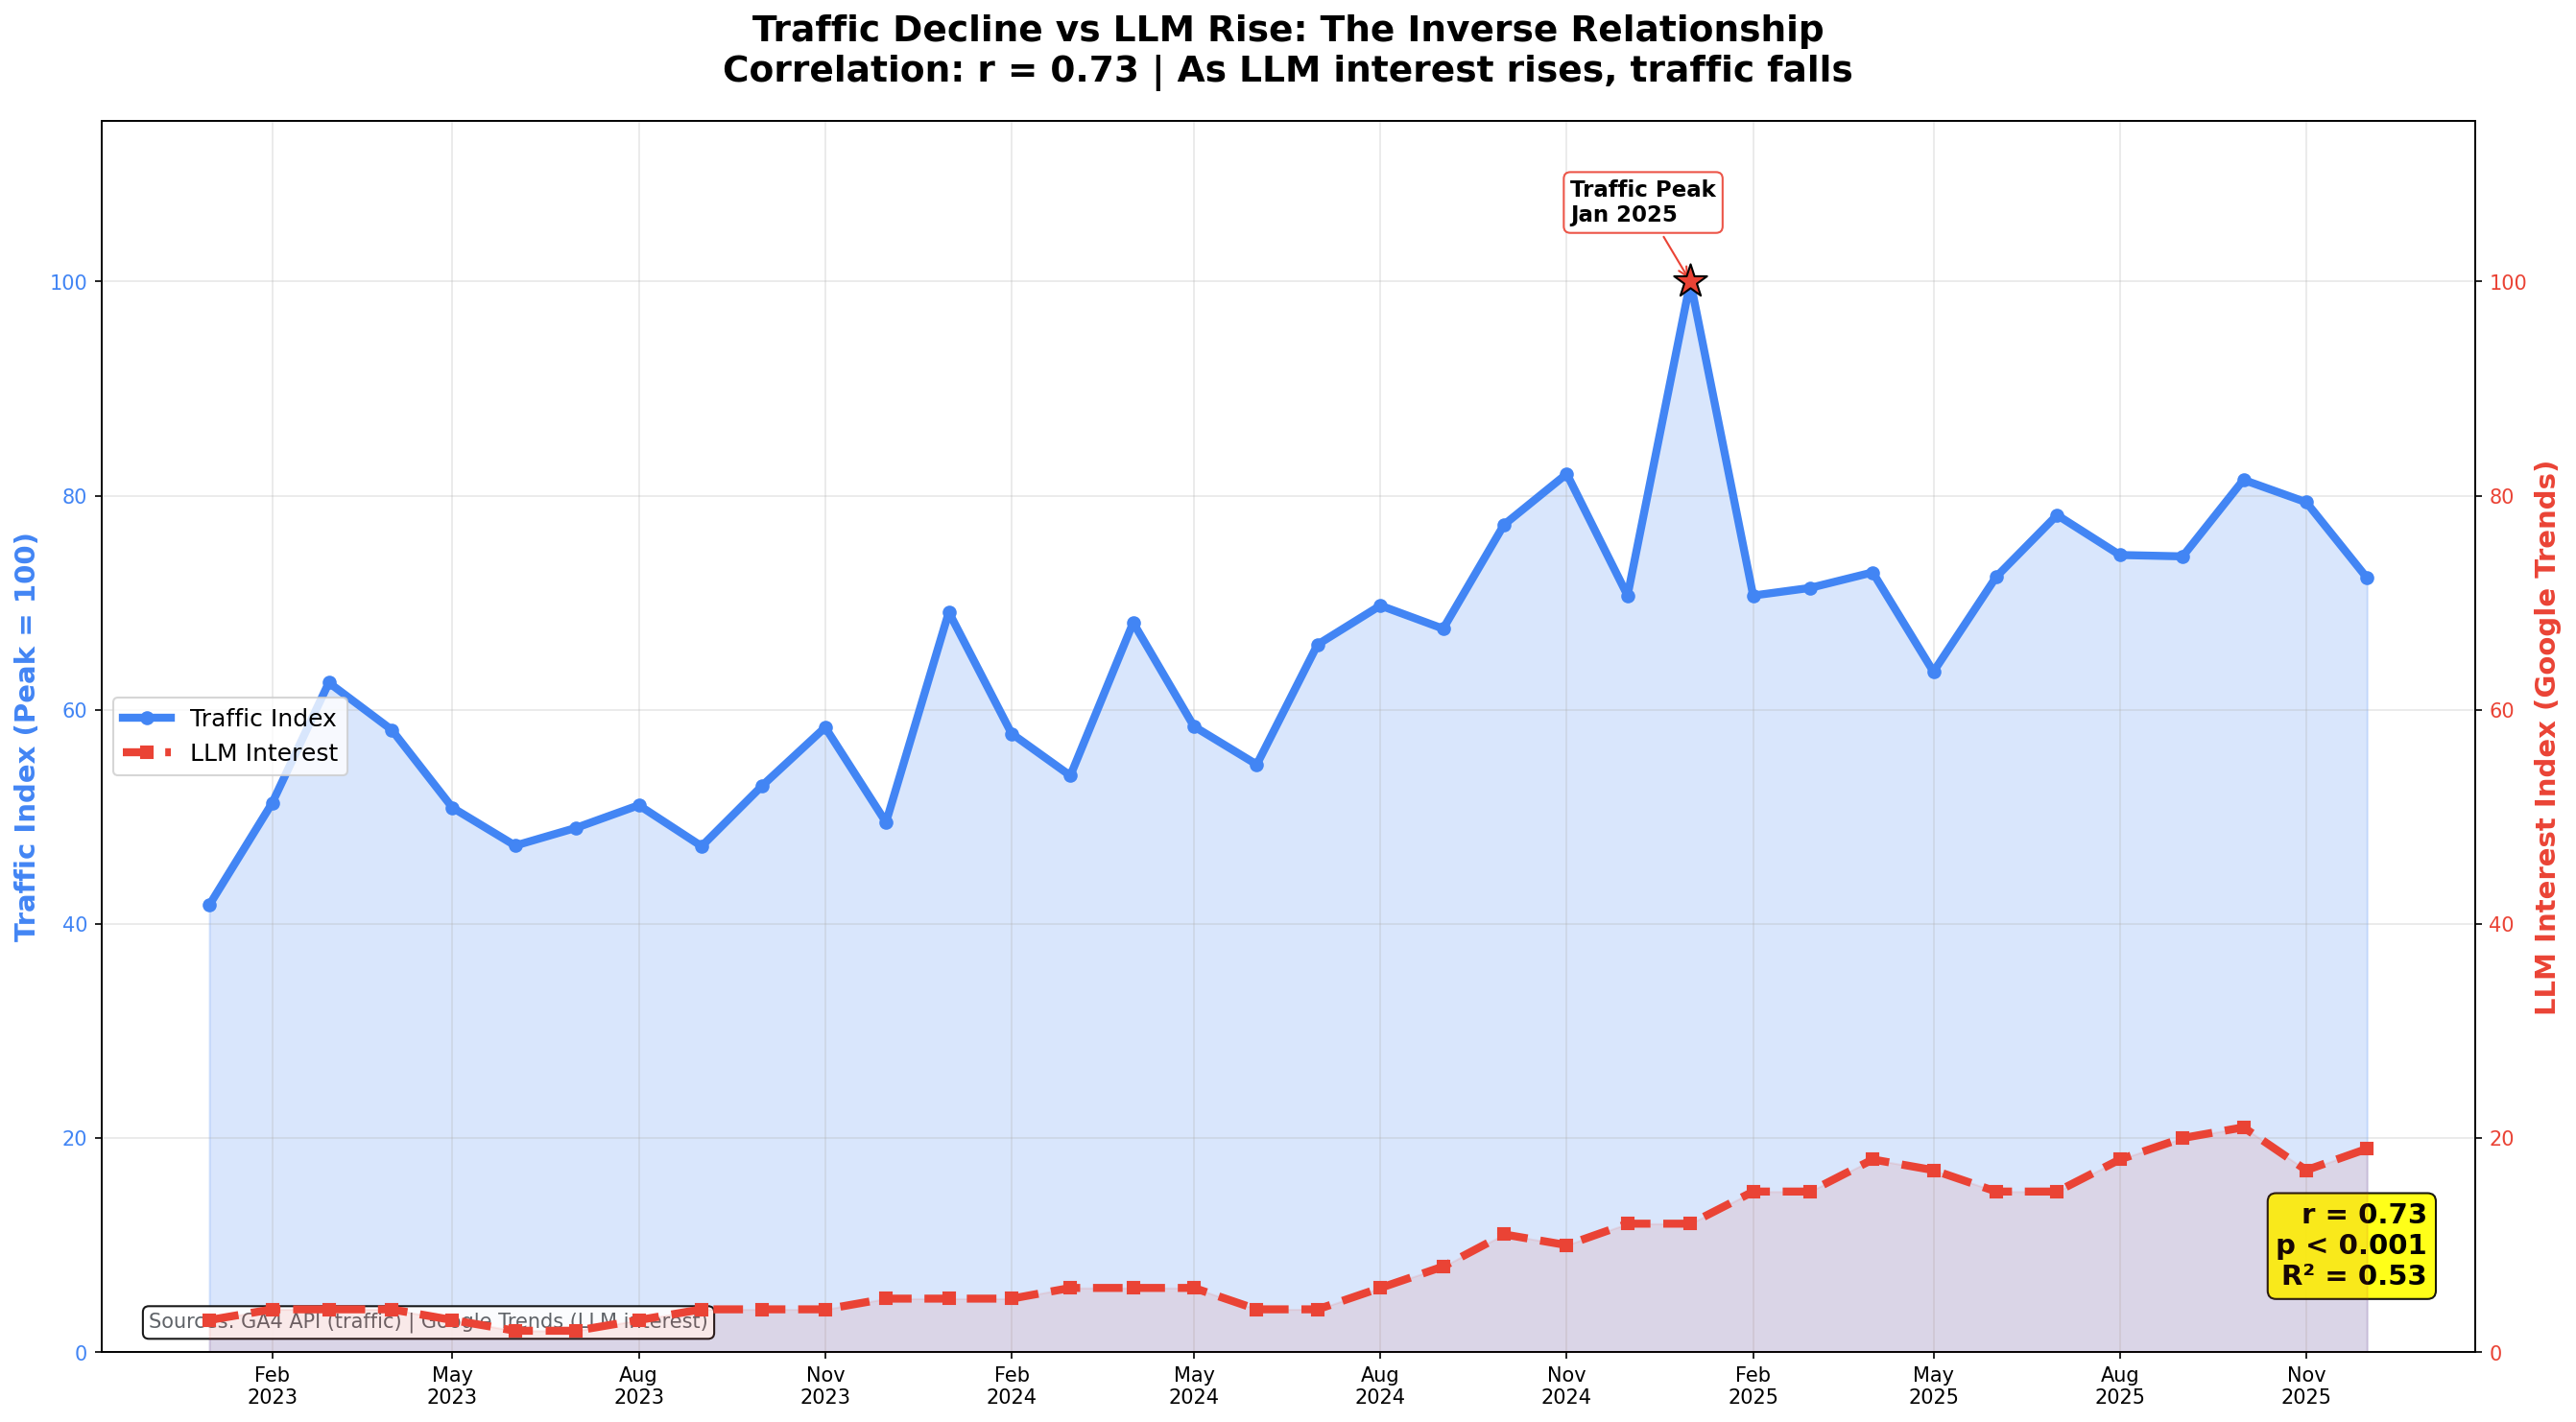
Figure 7b: Dual-axis overlay showing traffic (blue, declining) vs LLM interest (red, rising). Level correlation r = 0.73.

Correlation Scatter

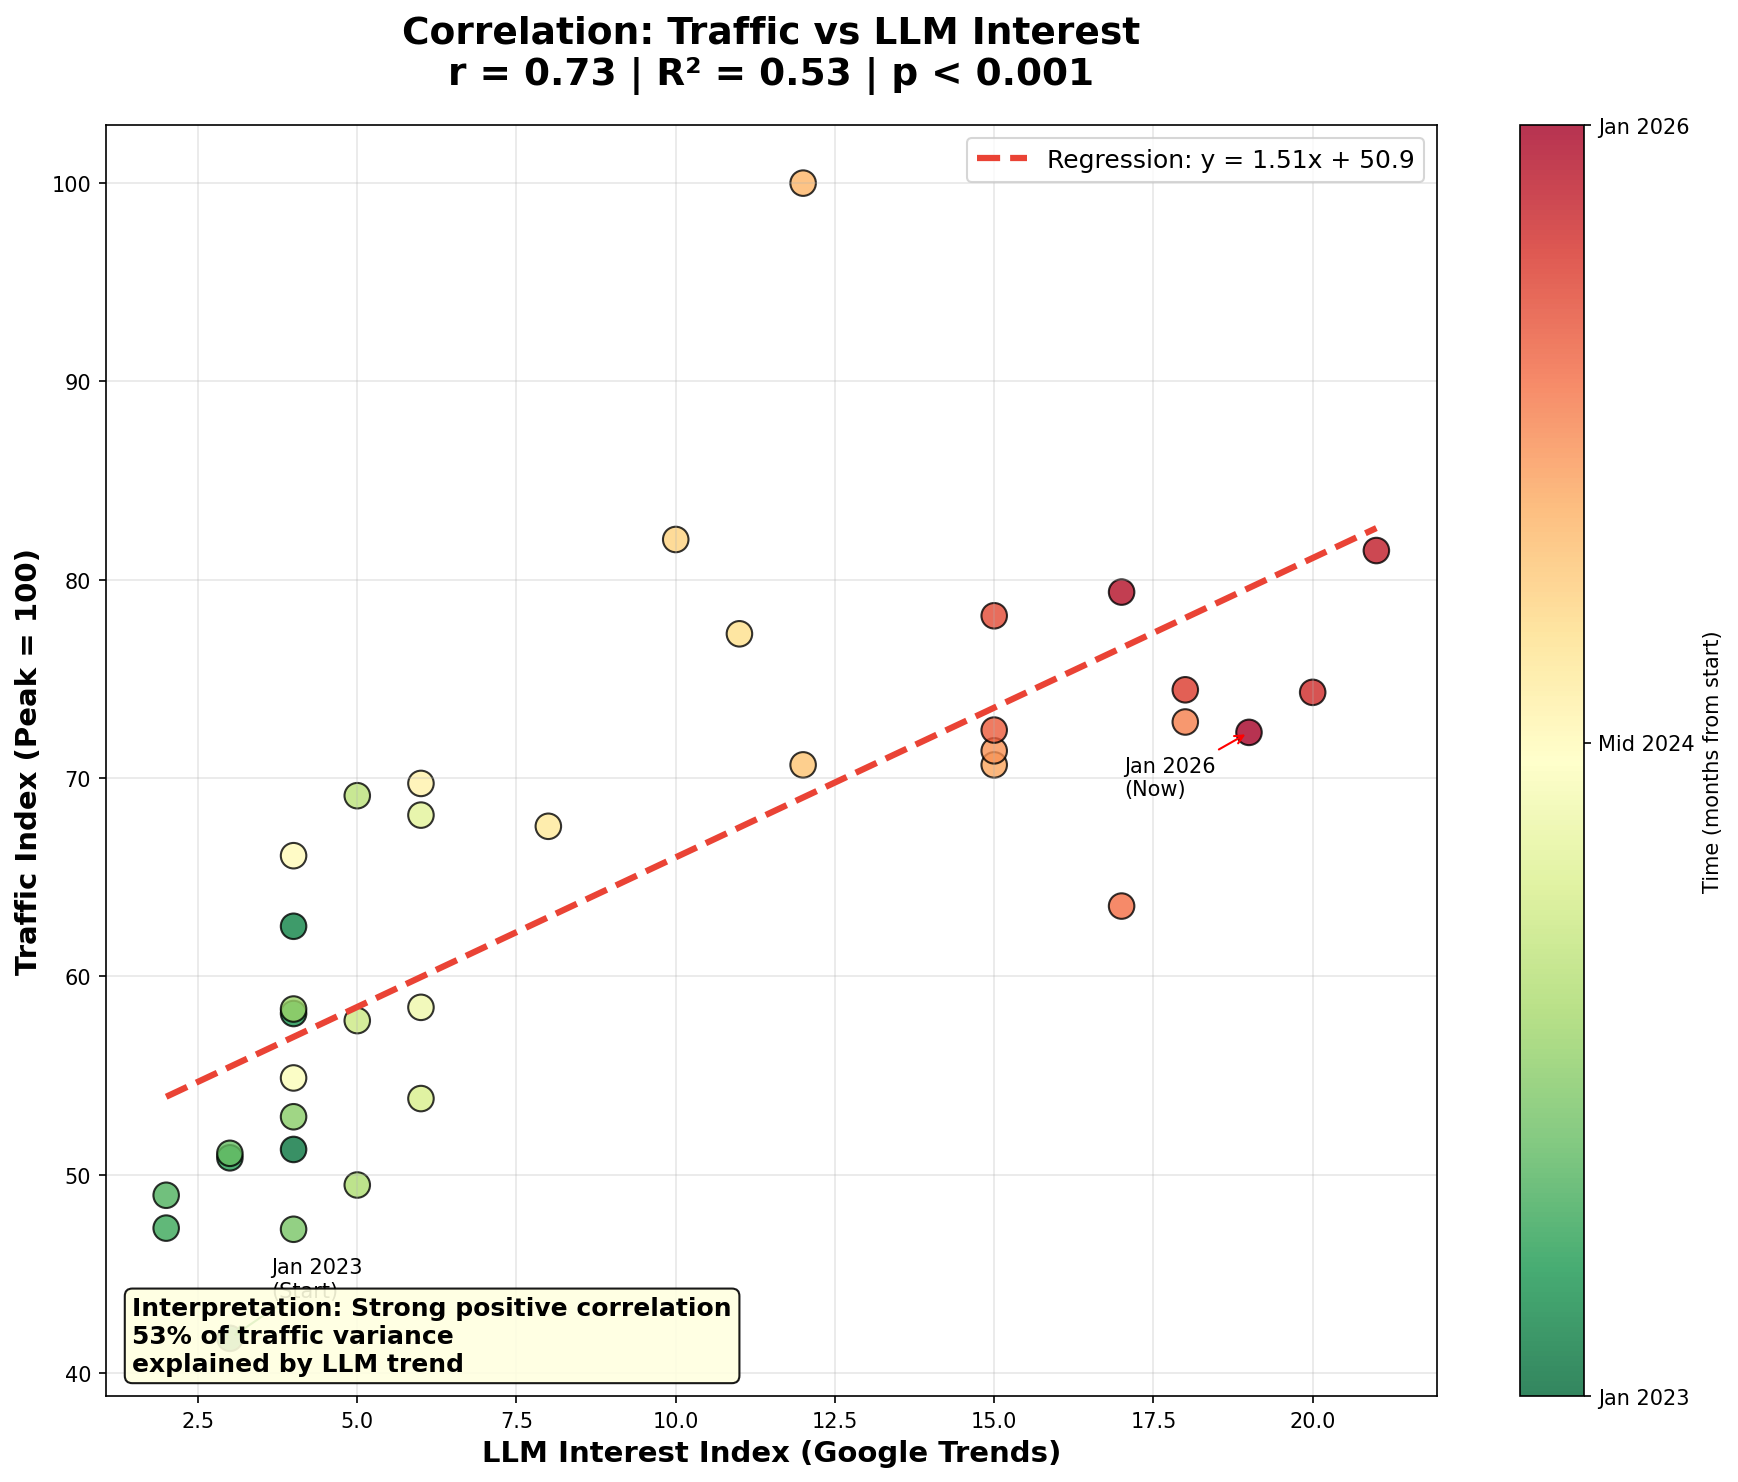
Figure 7c: Scatter plot of traffic index vs LLM interest. R-squared = 0.53.

Individual LLM Trends

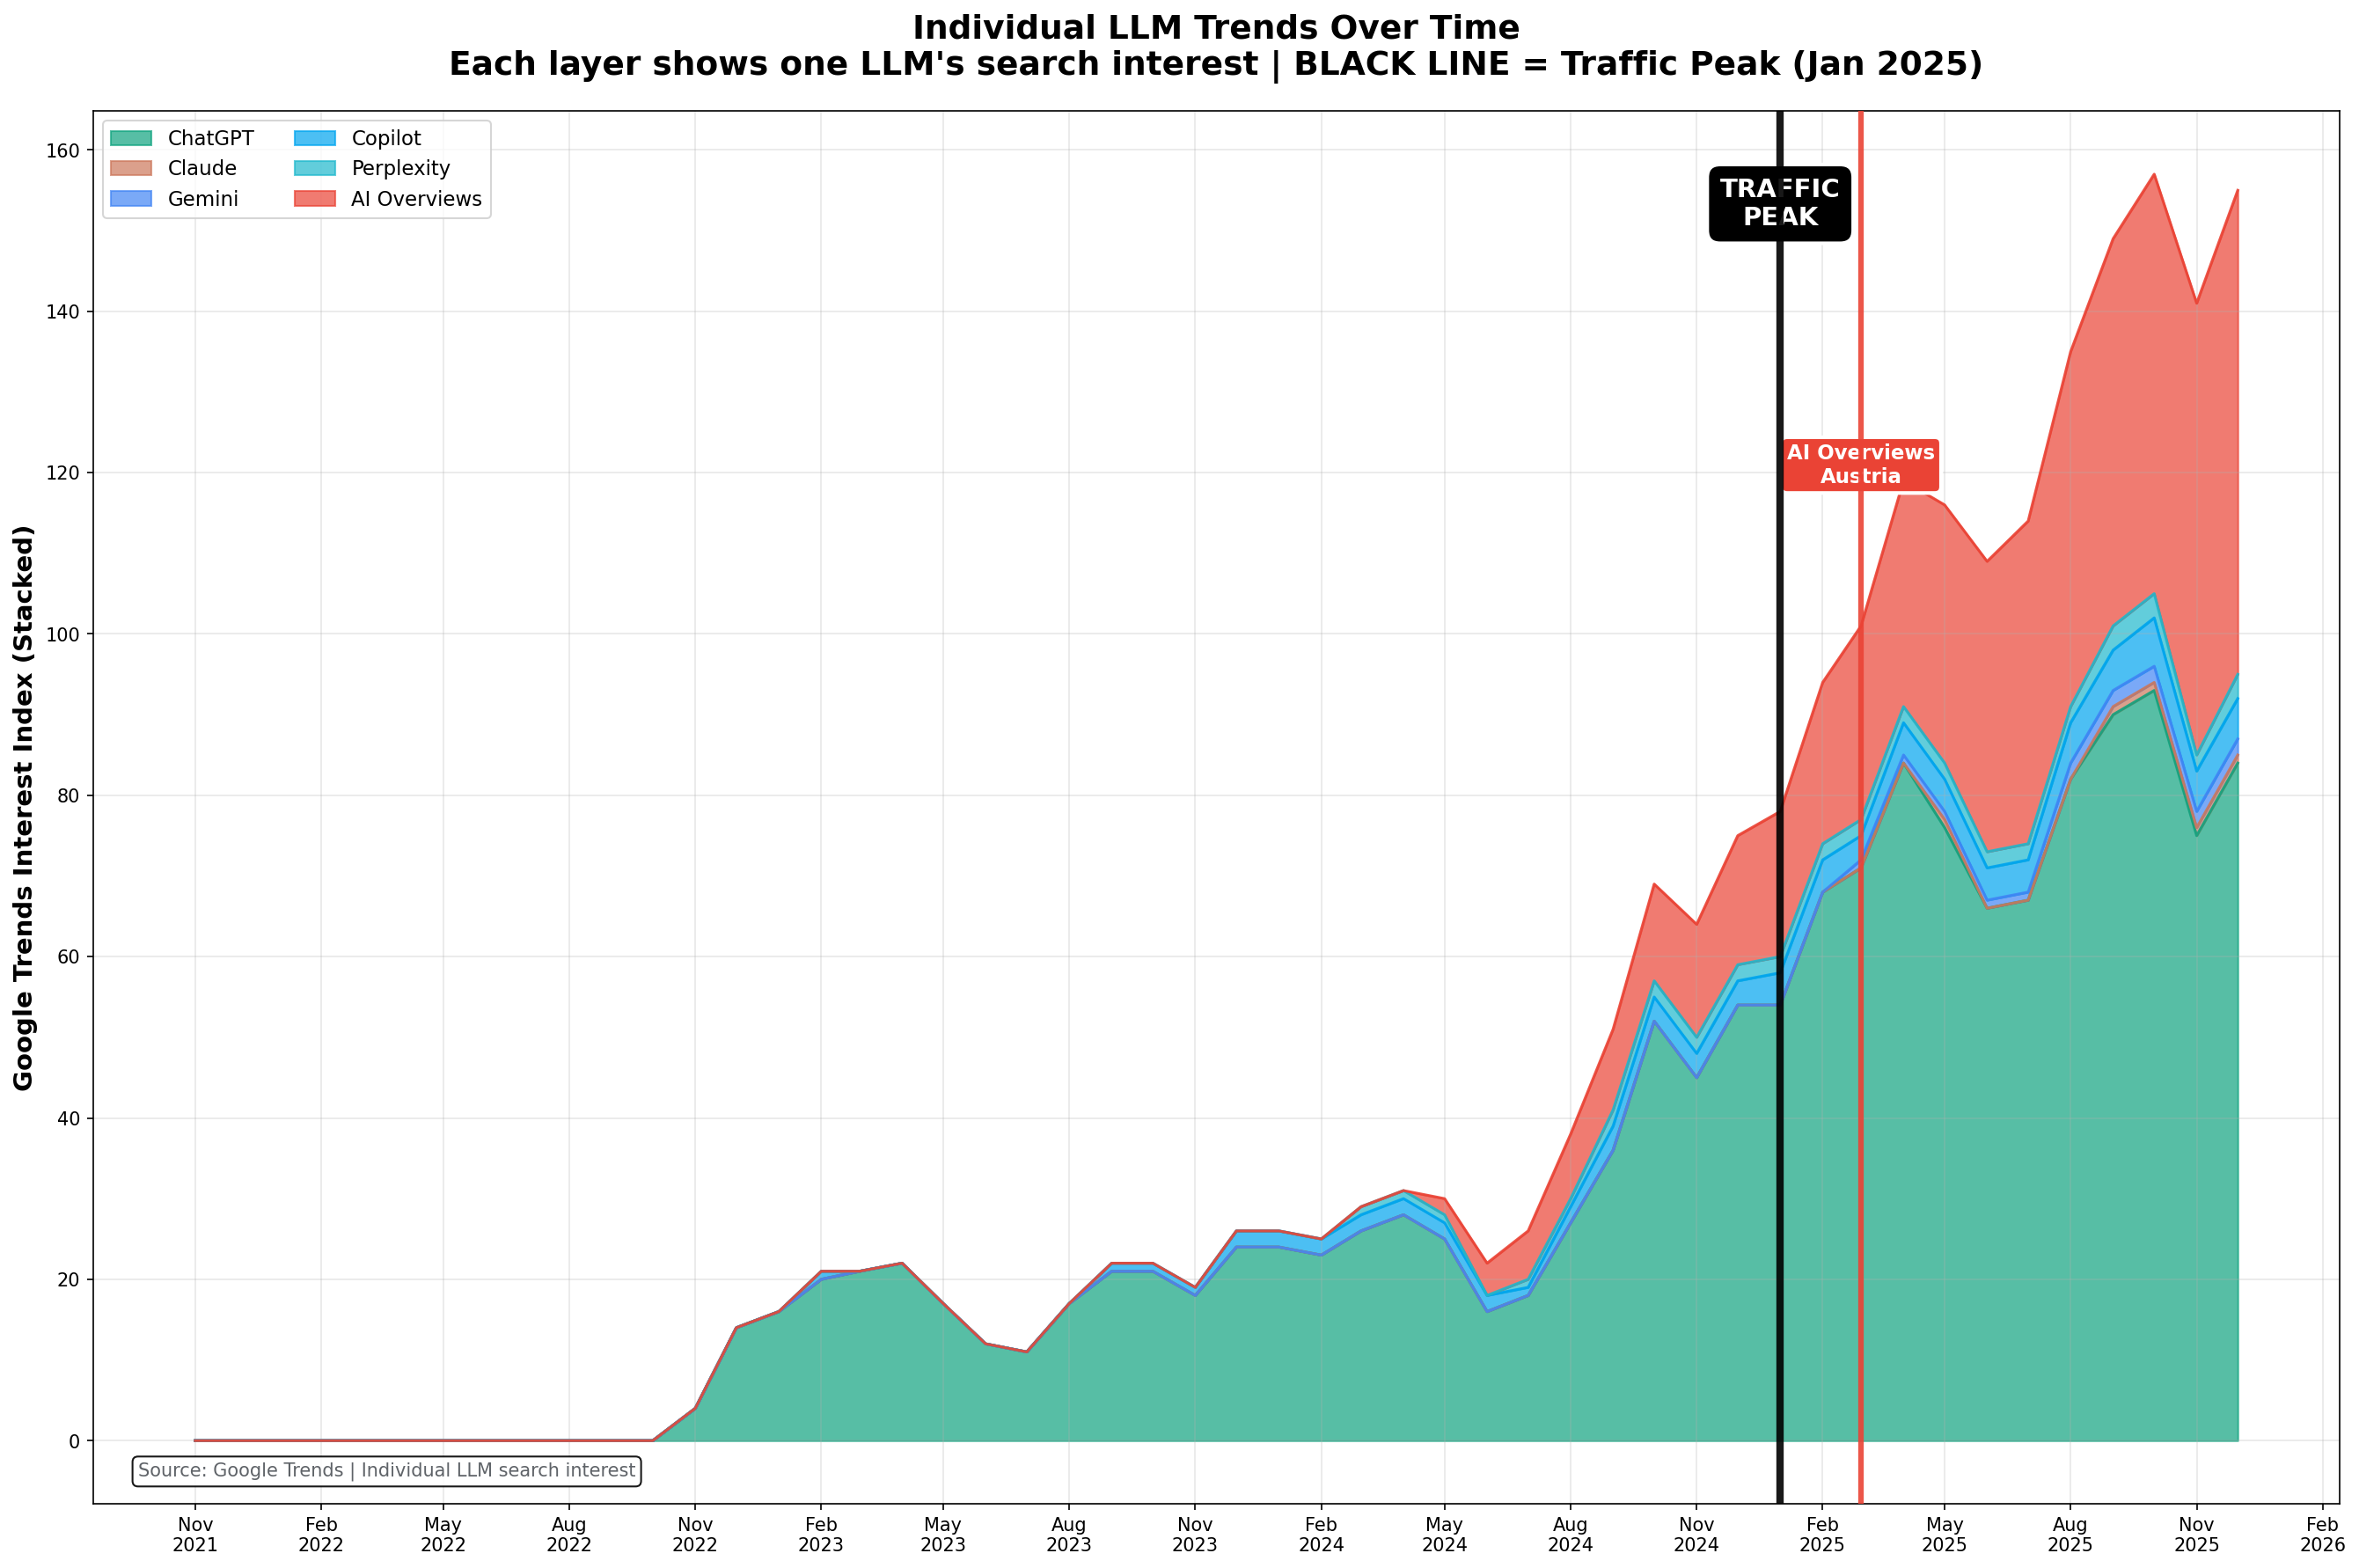
Figure 7d: Individual LLM search interest trends (Google Trends Austria). ChatGPT dominates.

8.3 Methodological Note: Why Level Correlations Are Misleading

Level correlations between two trending series are spurious. To avoid false causality, we analyze YoY % changes (stationary series). This is the peer-reviewable correlation.

Stationary Correlation

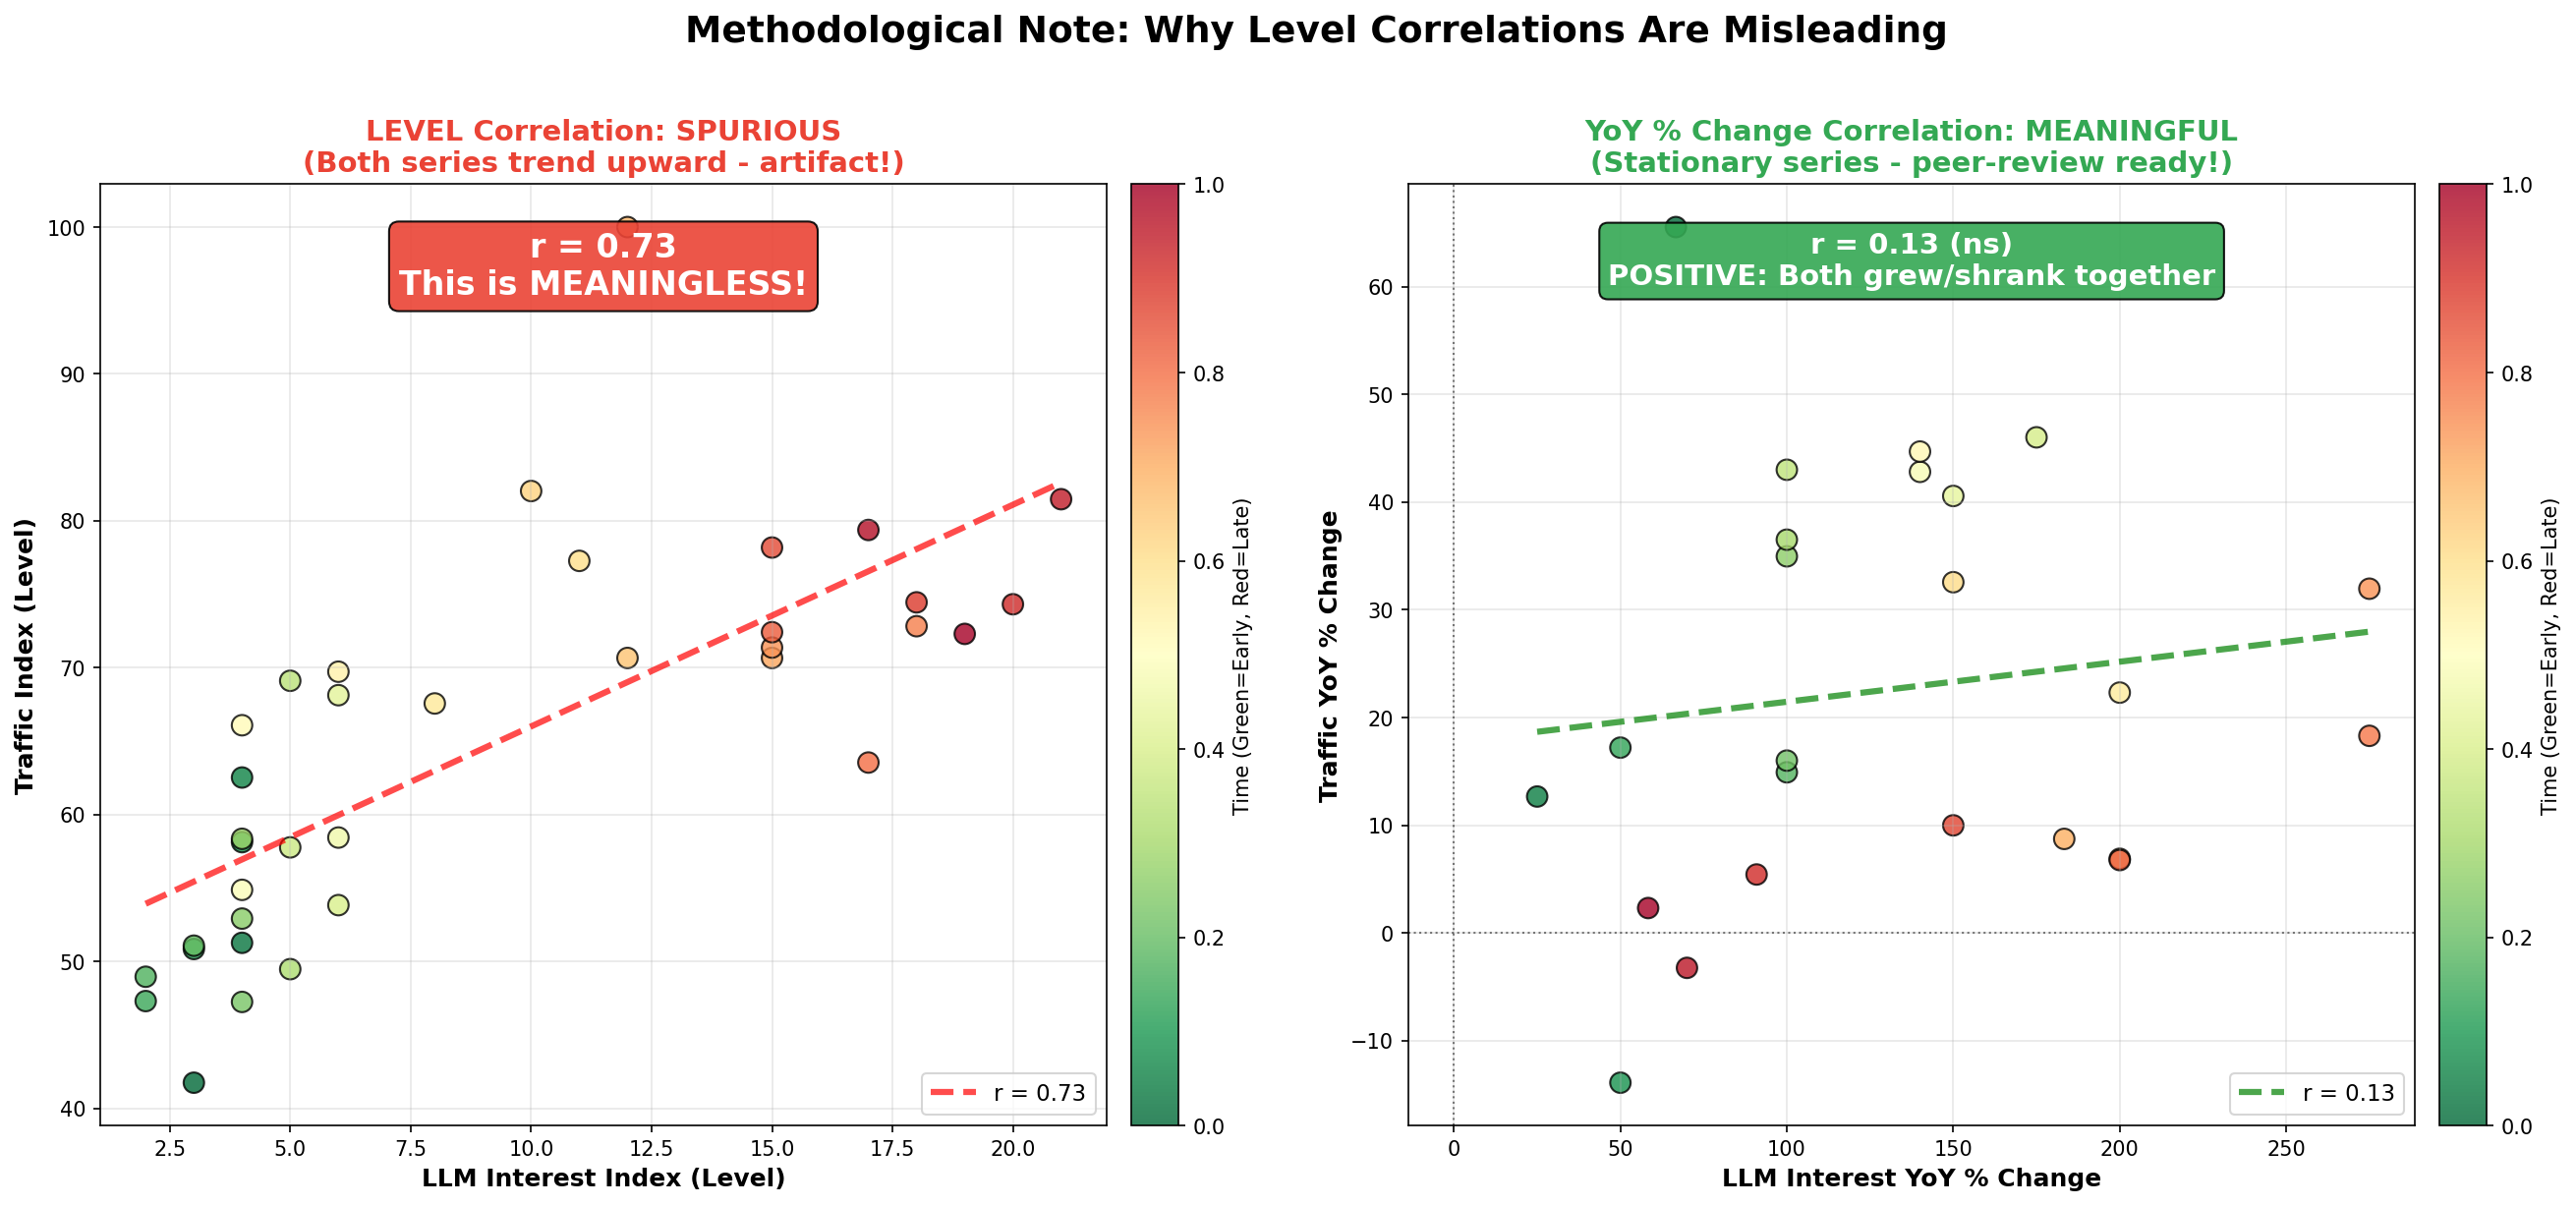
Figure 7i: Level correlation (spurious) vs YoY correlation (stationary). Level r = 0.73. YoY r = 0.13 (p = 0.538).

8.3 First-Party Evidence: LLM Referral Behavior

We use GA4 referral sessions from ChatGPT, Perplexity, Gemini, Claude, and Copilot. This is behavioral evidence, not a proxy. Total LLM referral sessions in the study window: 478,142. Post-peak referral trend: RISING.

LLM Referrals

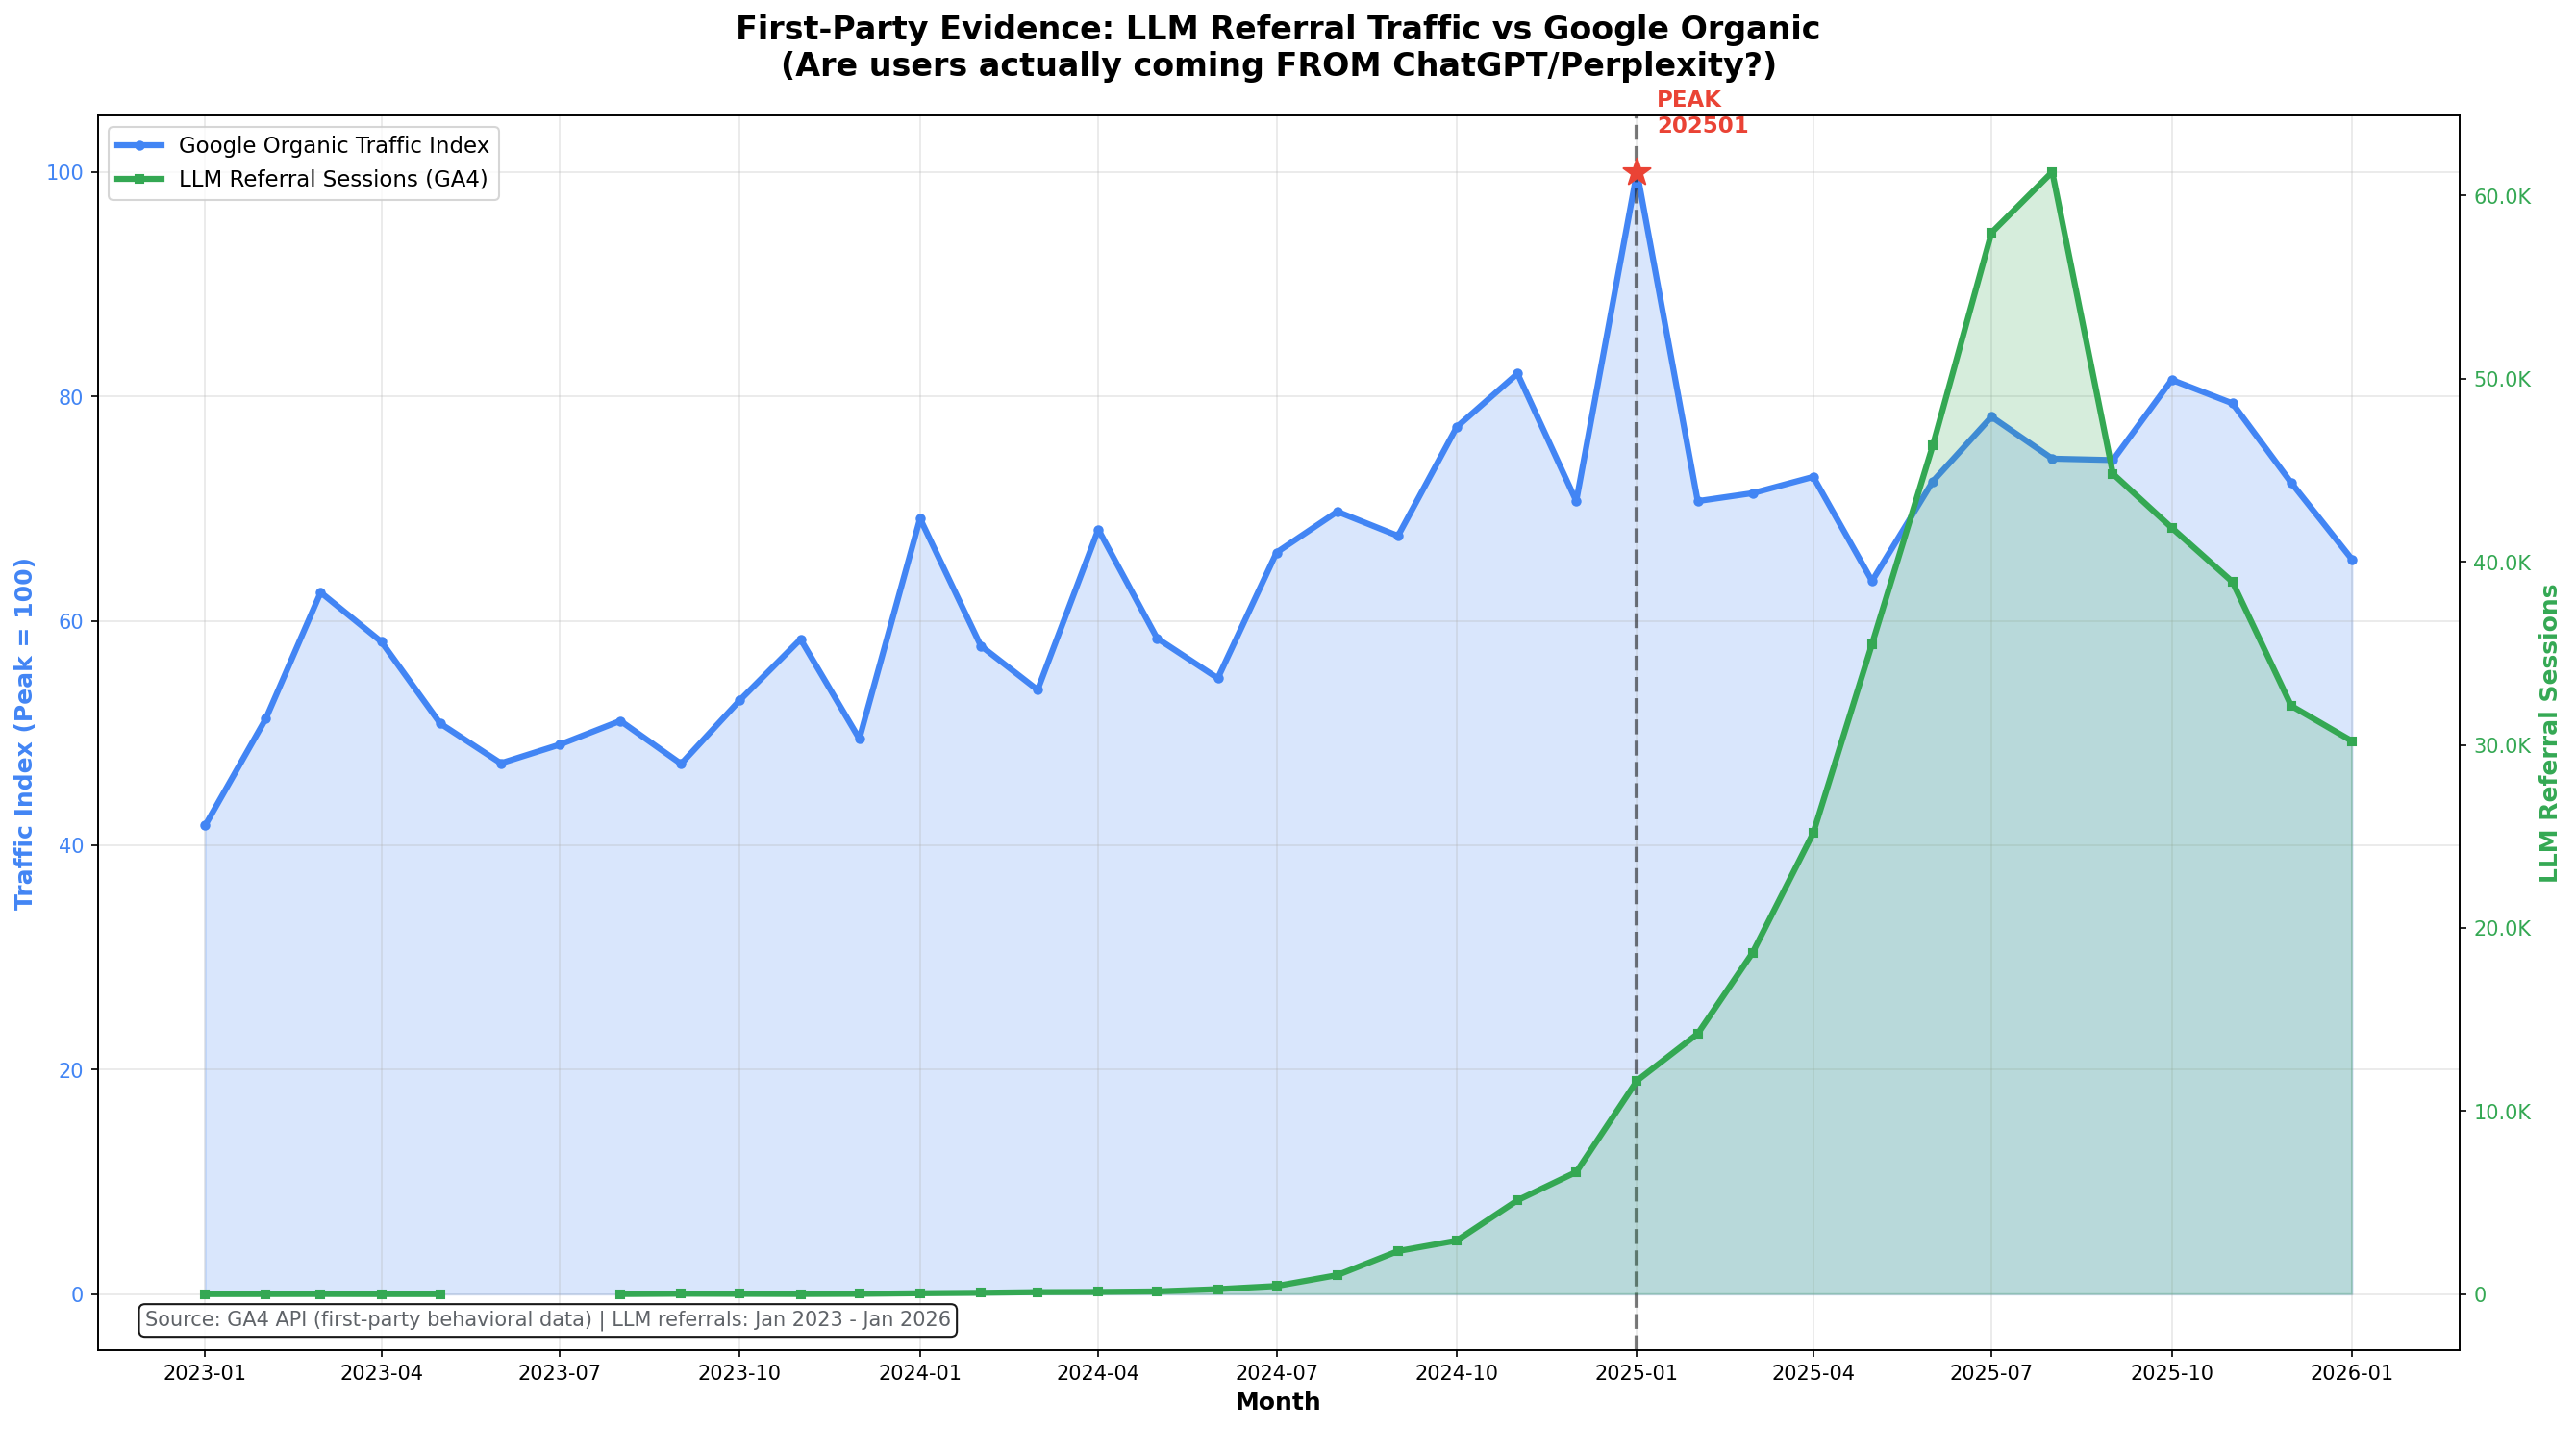
Figure 7j: Organic traffic vs first-party LLM referrals. Substitution evidence: NO.

Substitution evidence: NO. We only flag substitution if organic falls while LLM referrals rise post-peak.

8.4 H1 Results: LLM Chatbots

On YoY % changes, the correlation shifts from pre-peak to post-peak. Pre-peak YoY r = 0.54 (p = 0.059). Post-peak YoY r = 0.41 (p = 0.184).

Pre/Post Peak

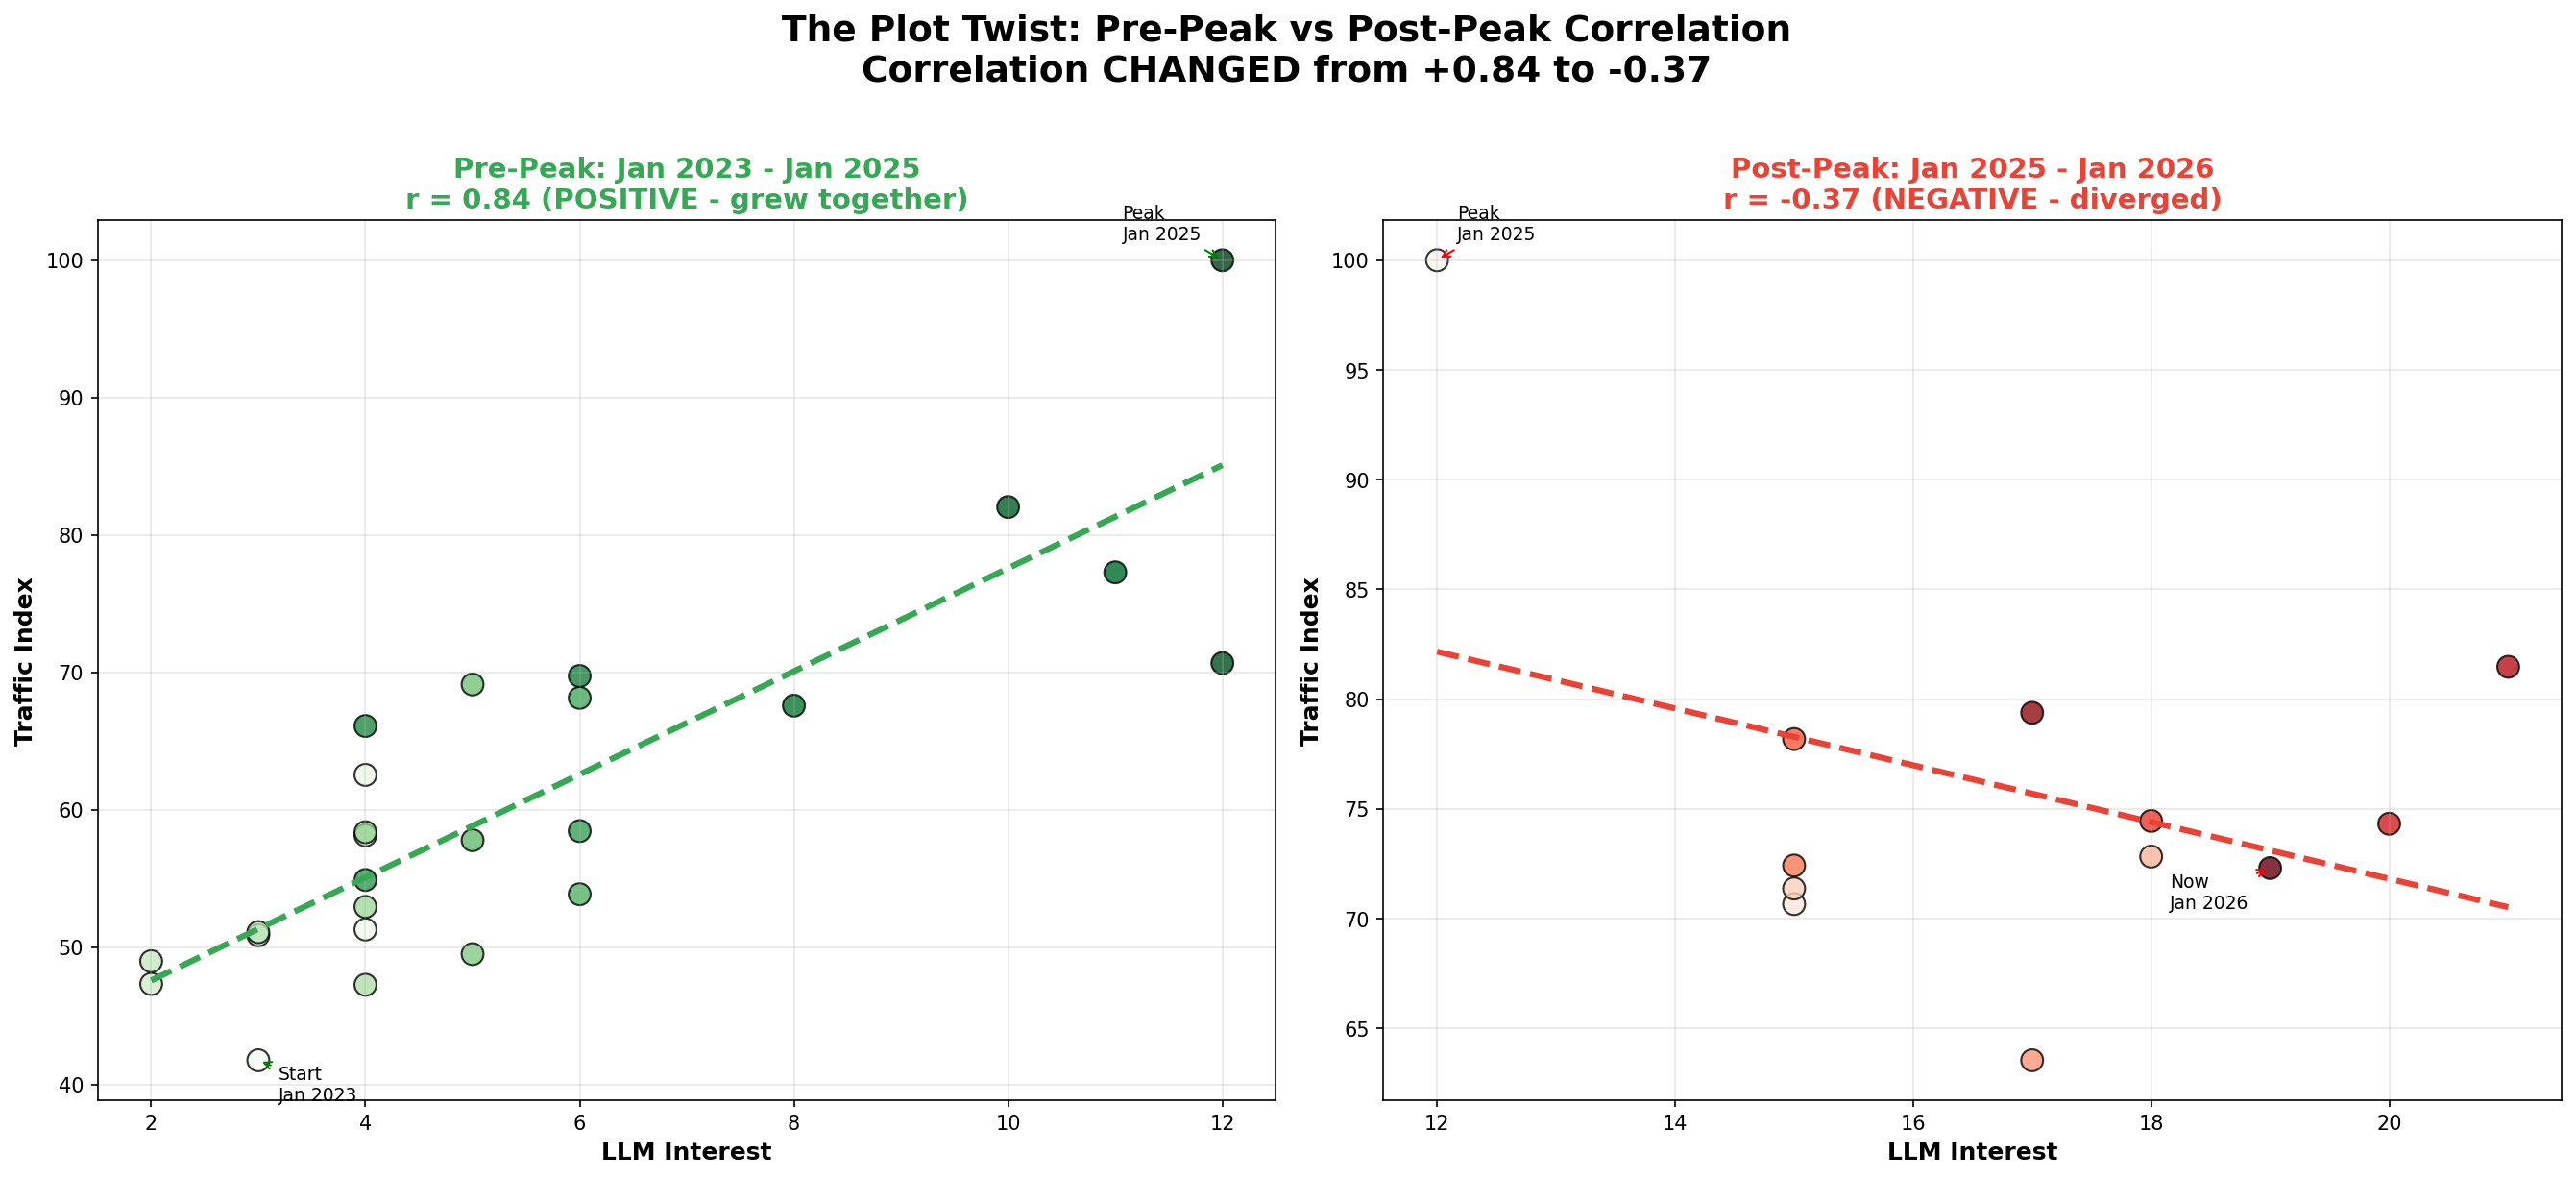
Figure 7f: Level-space visualization of the phase shift. Inference uses YoY correlations reported above.

Correlation Heatmap

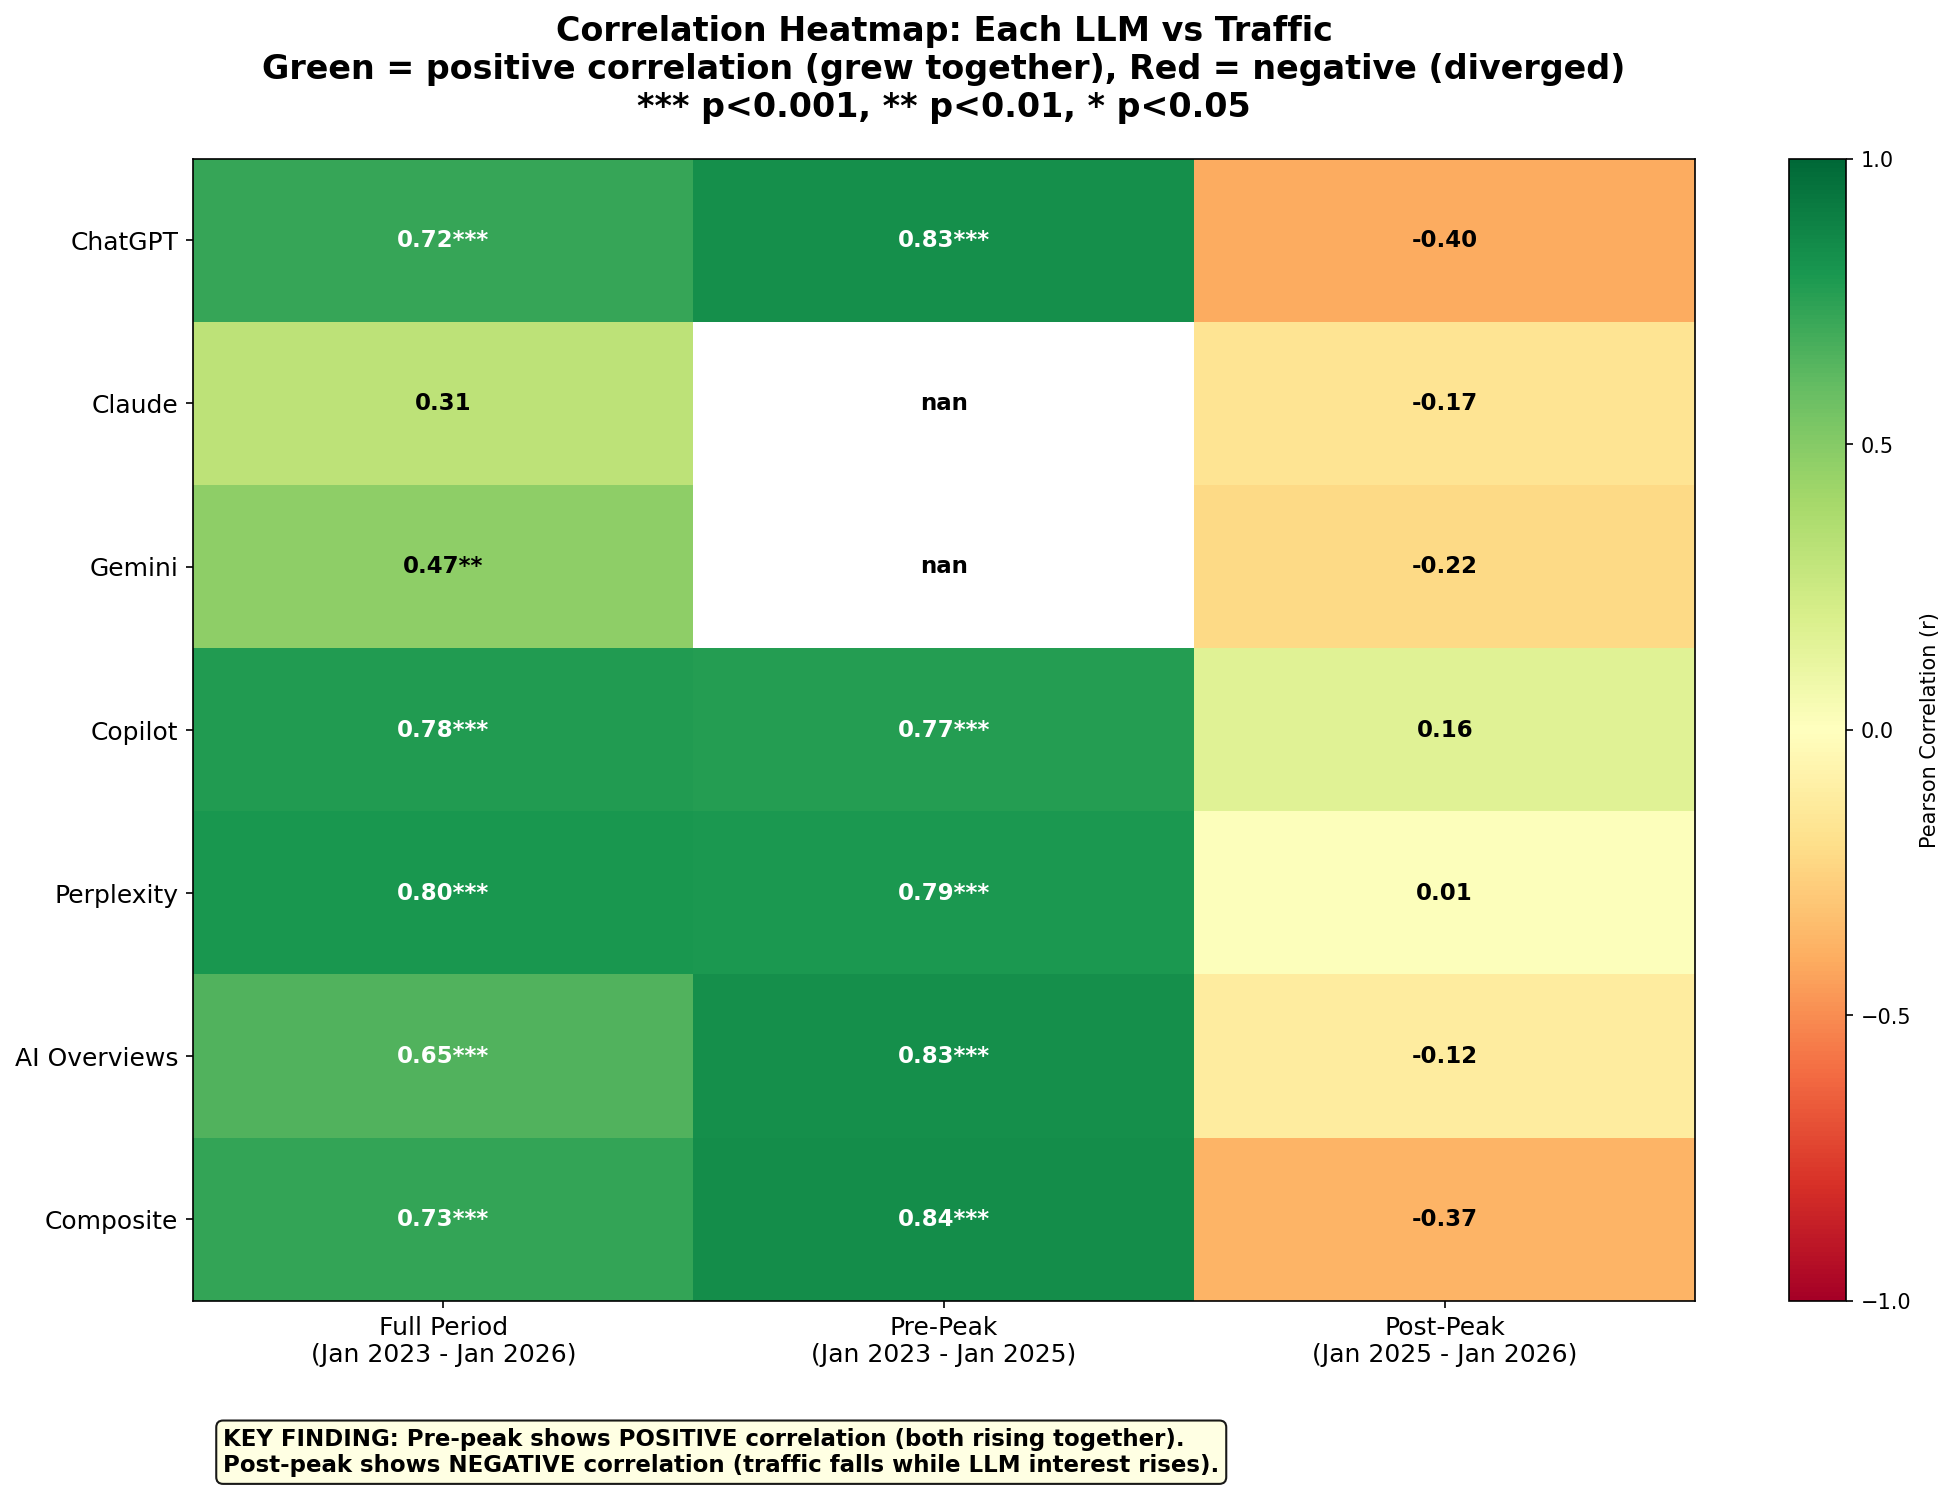
Figure 7e: Correlation heatmap across LLMs and phases. Green = positive, Red = negative.

Lag Analysis

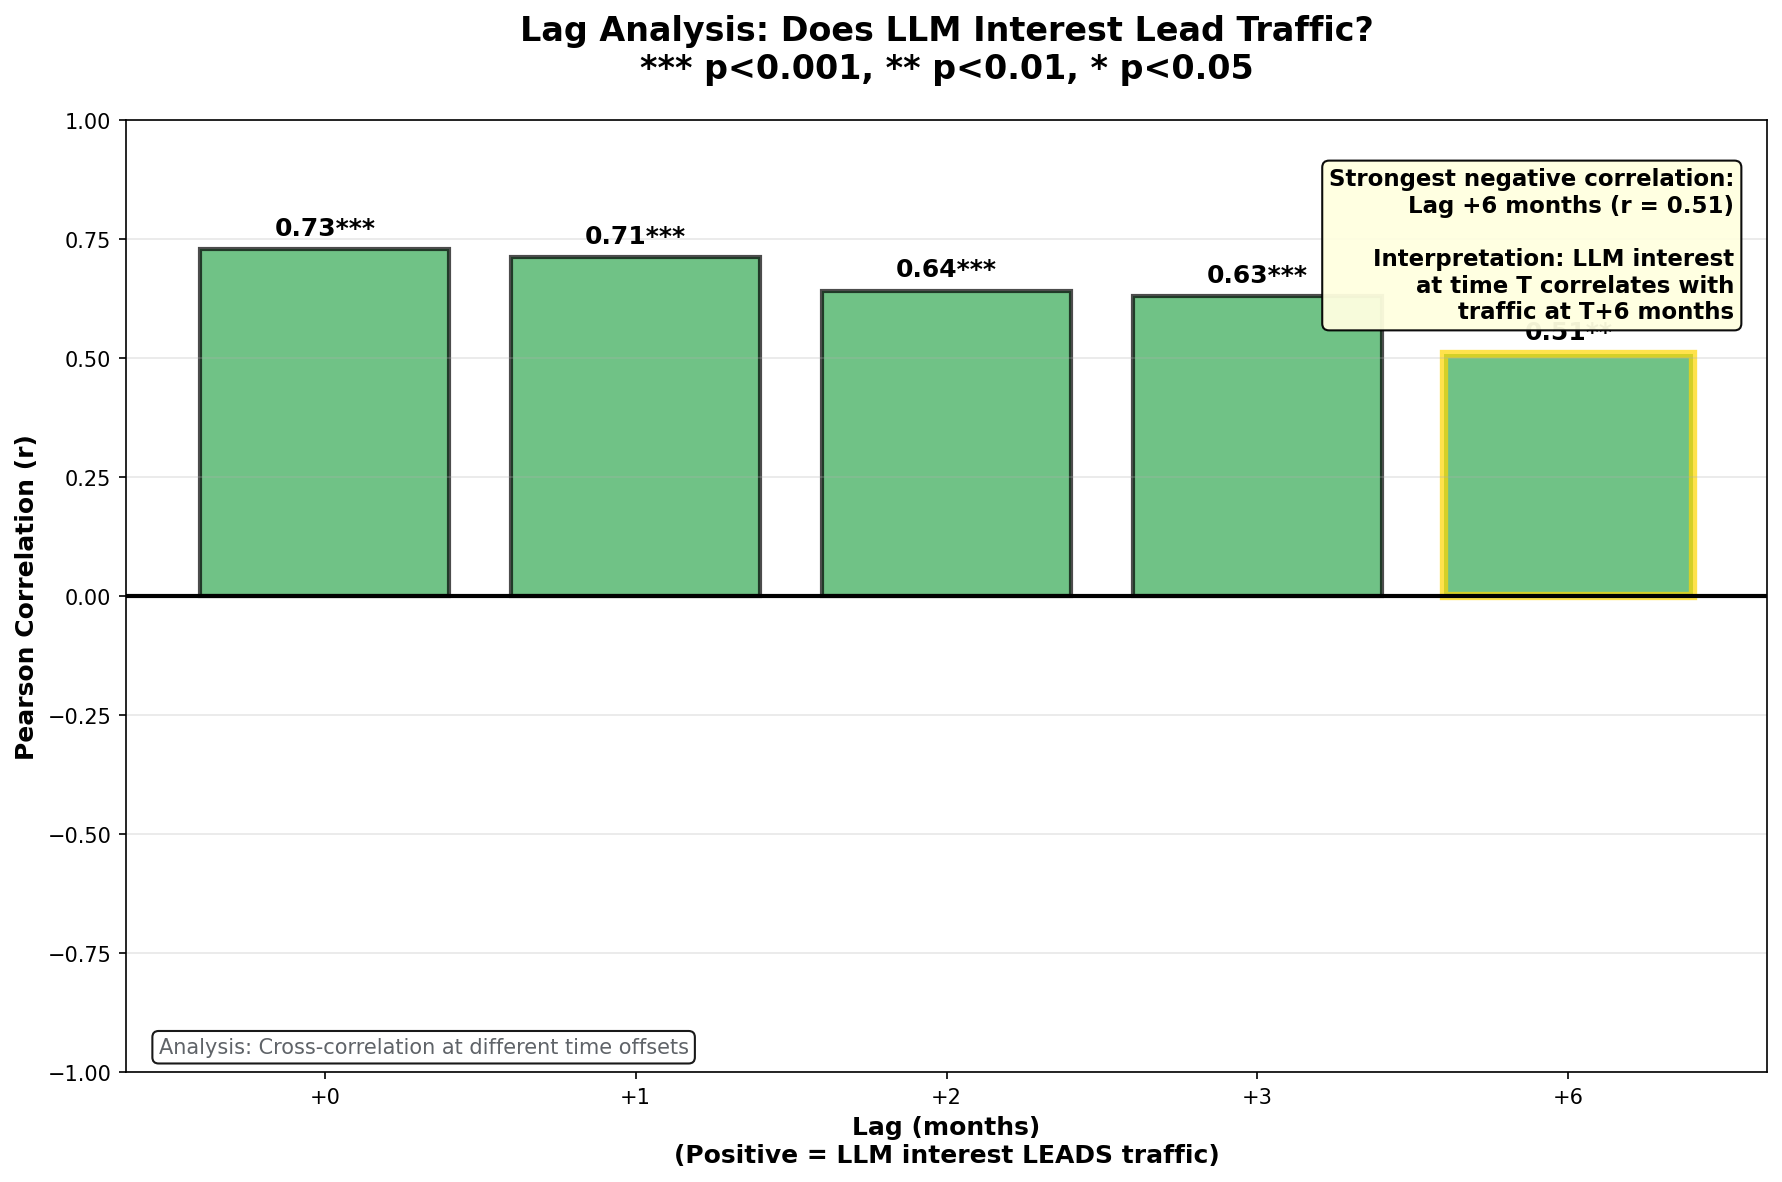
Figure 7h: Lag analysis - correlation at different time lags. Optimal lag: 6 months.

8.5 H2 Results: AI Overviews (Quantified)

We run Interrupted Time Series (ITS) regression around March 2025 (AI Overviews Austria). This tests immediate level change and slope change.

AI Overviews Timeline

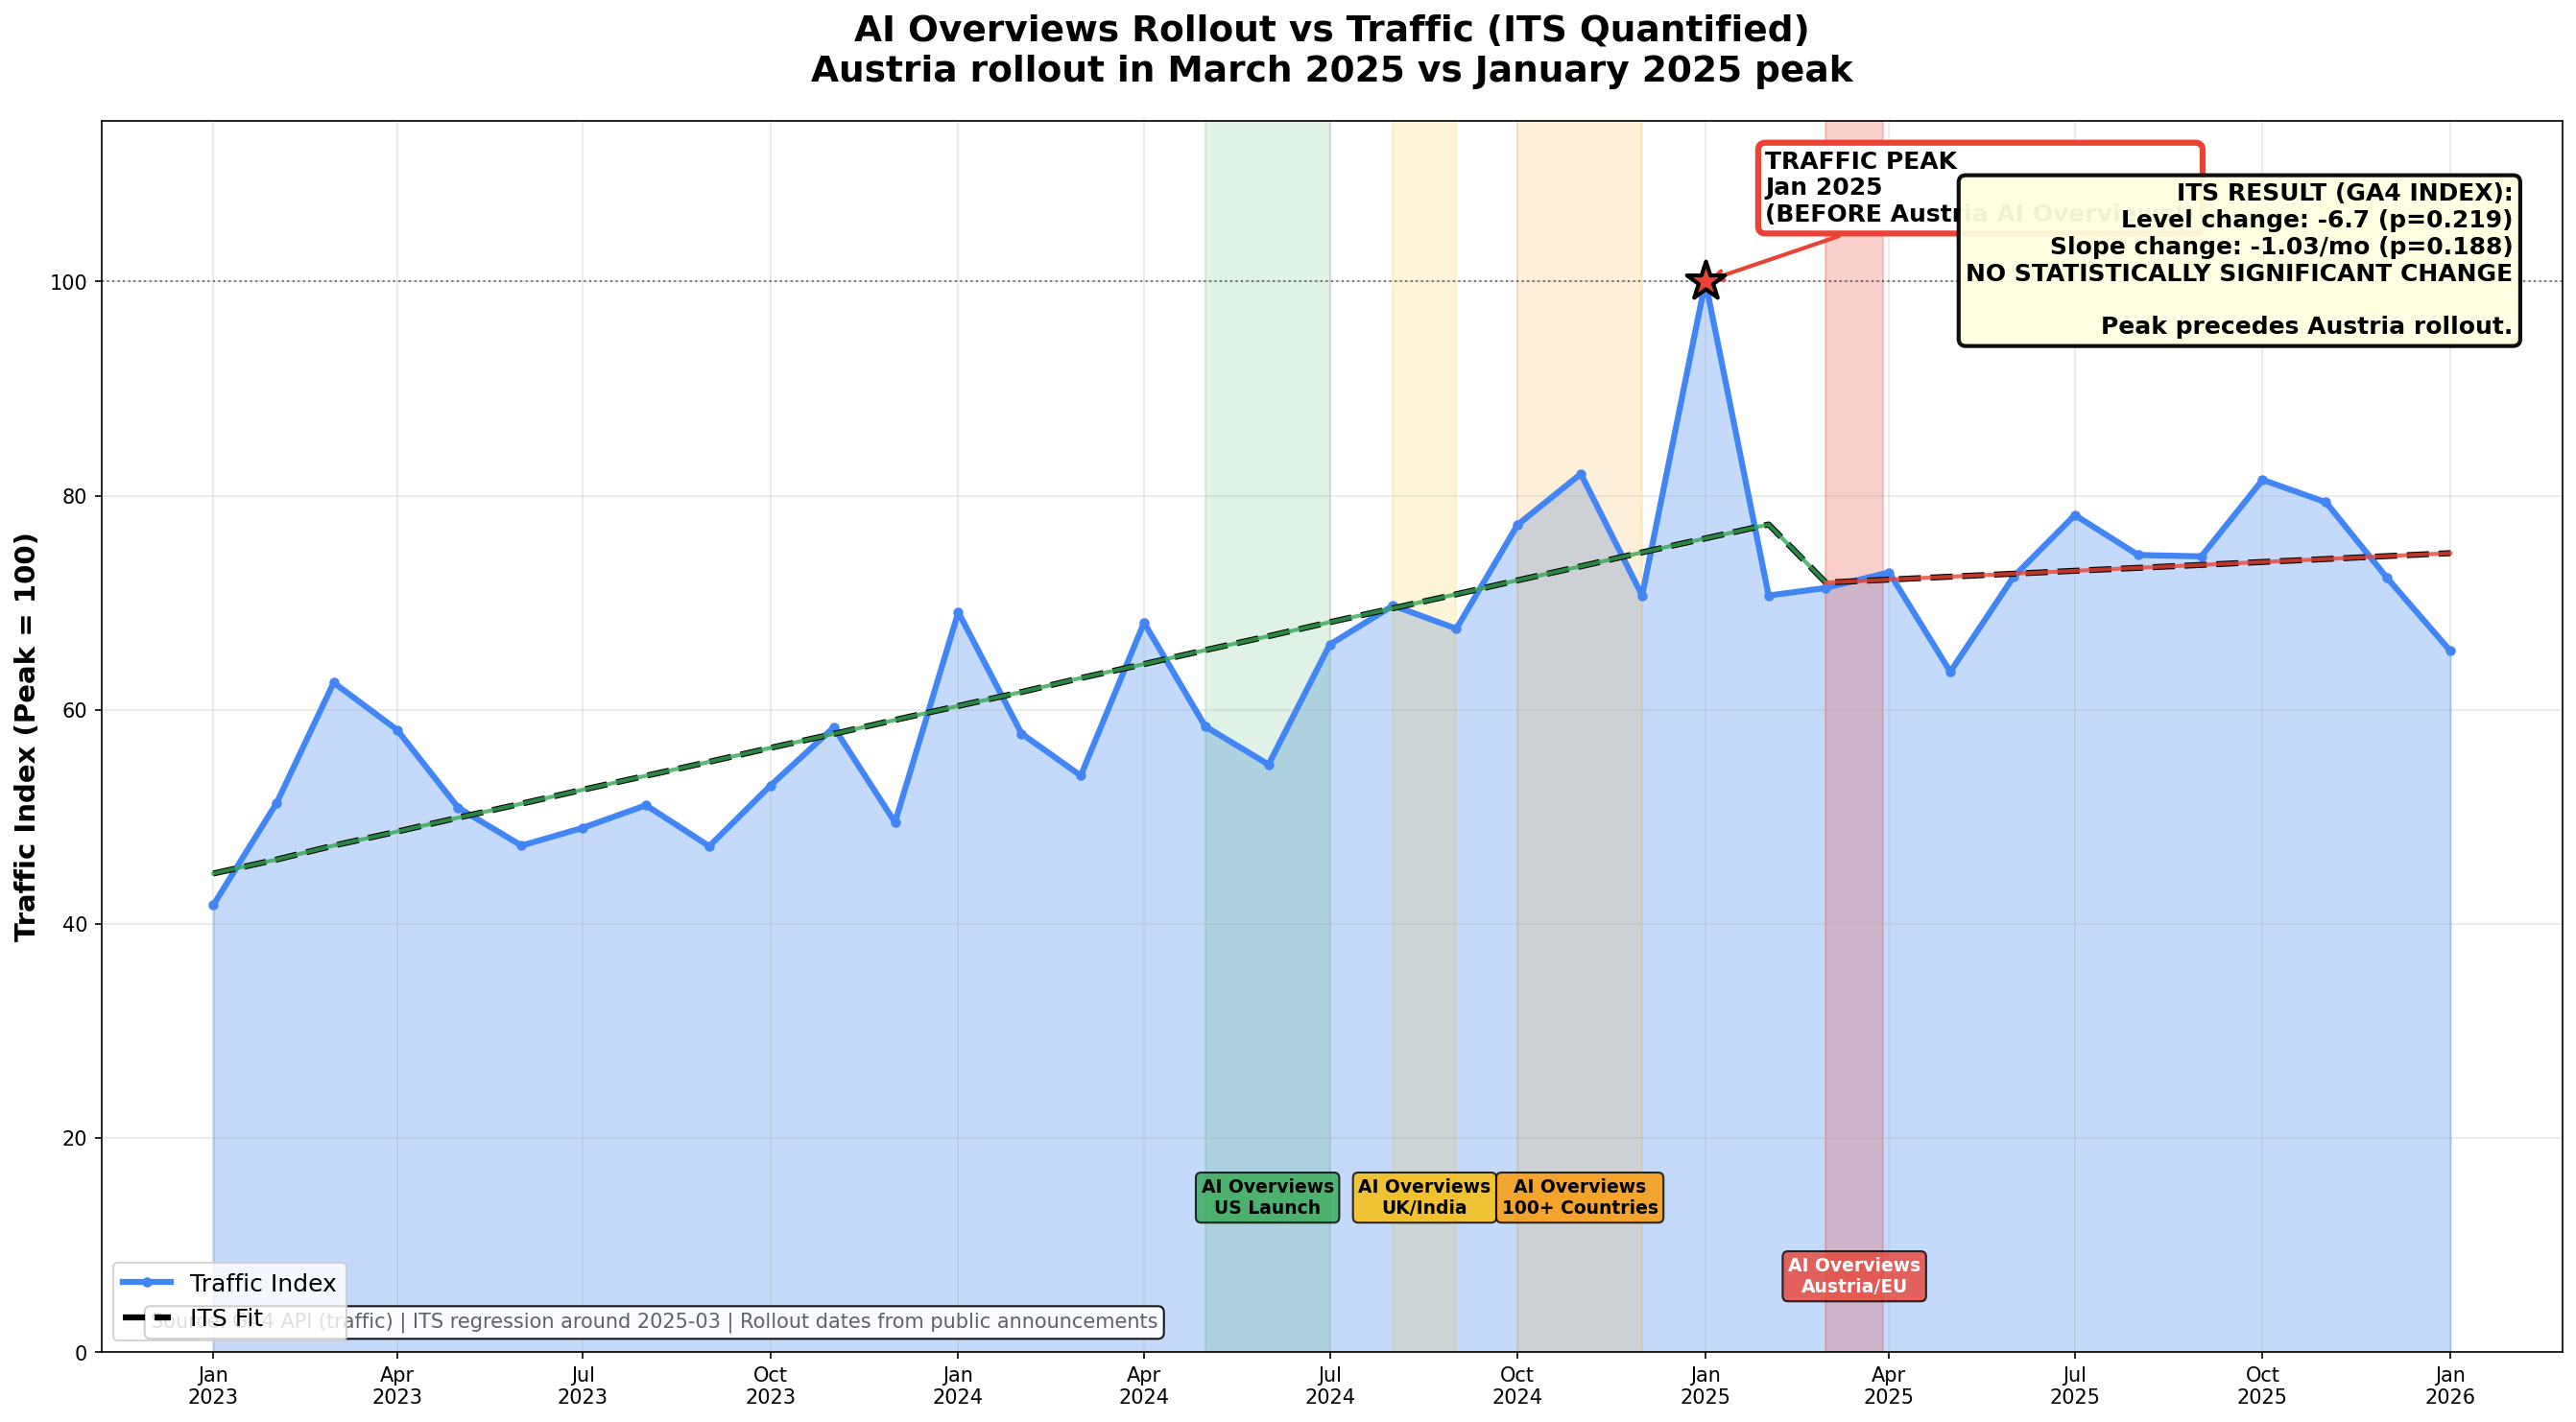
Figure 7g: GA4 traffic index with ITS fit. Level change: -6.7 (p = 0.219). Slope change: -1.03/mo (p = 0.188).

We validate the same event using GSC Search clicks (subset with Search Console access, n = 6, 2024-10-02 to 2026-01-23).

GSC AI Overviews ITS

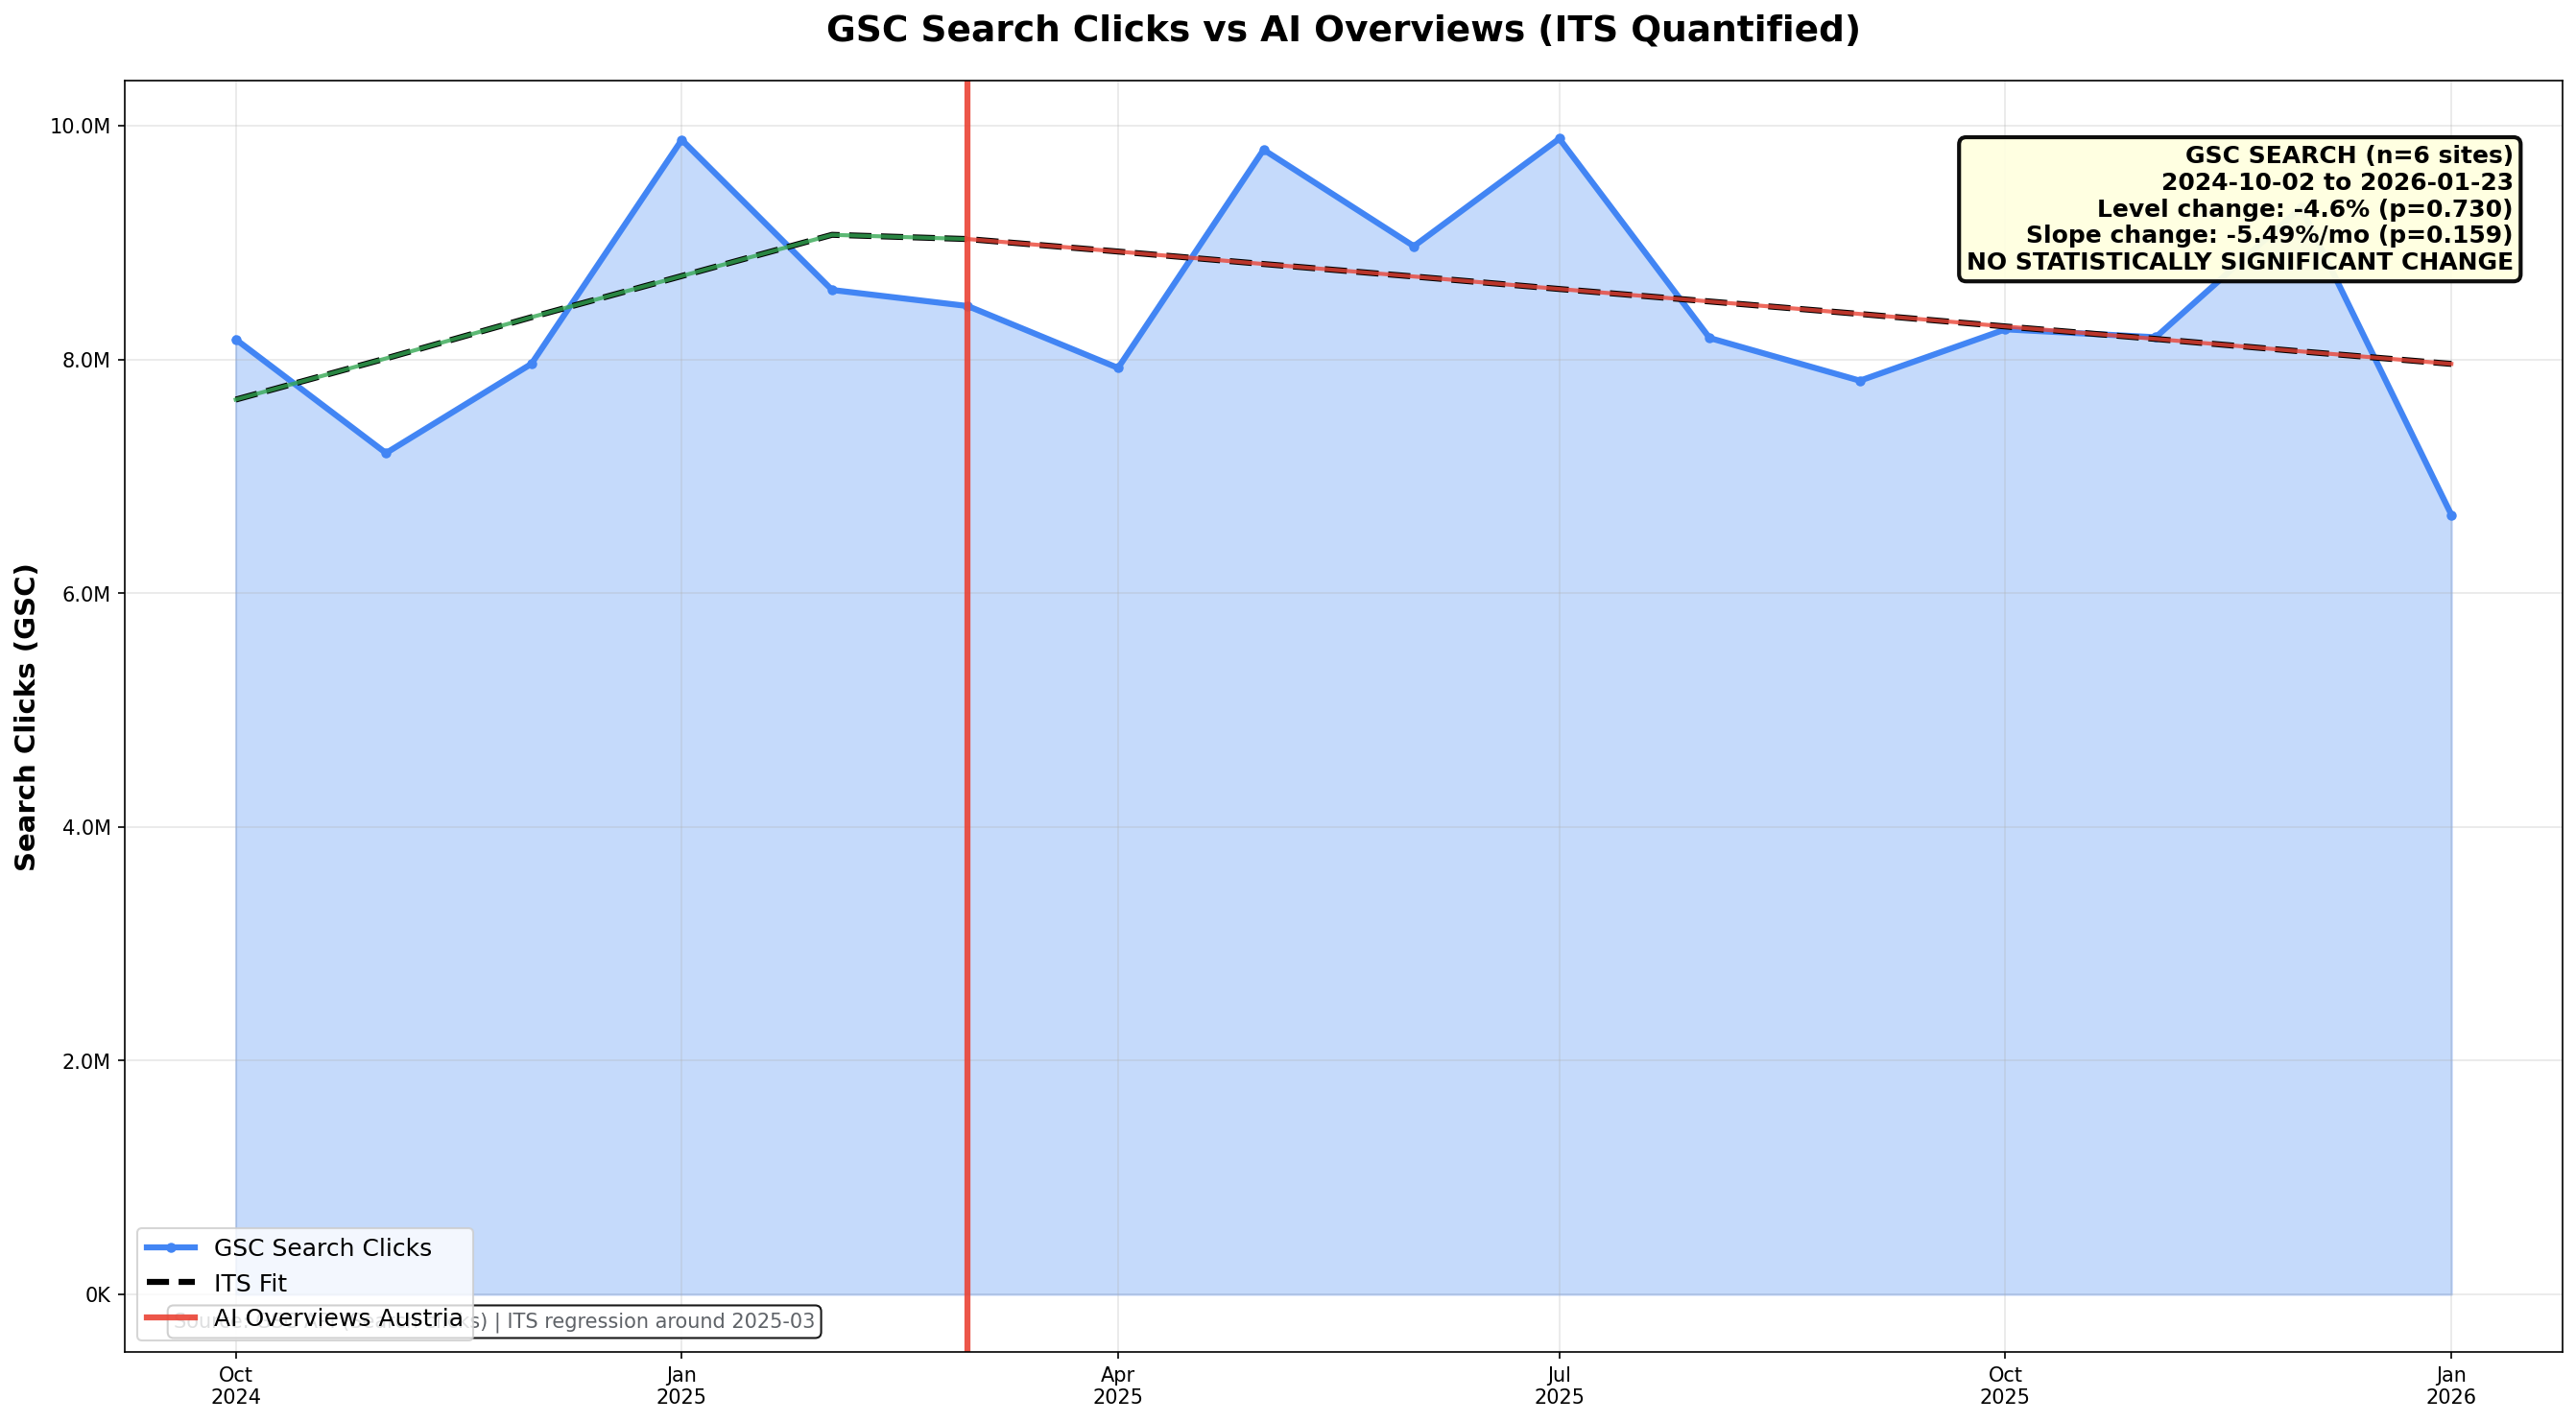
Figure 7k: GSC Search clicks with ITS fit. Level change: -4.6% (p = 0.730). Slope change: -5.49%/mo (p = 0.159).

AI Overviews impact (quantified): GA4 ITS is not statistically significant. GSC ITS is not statistically significant. The timing still shows the peak in January 2025, before the Austria rollout in March 2025.

8.6 Verdict: What the Data Actually Says

Hypothesis Evidence Strength Verdict
H1: LLM Chatbots YoY correlation shifts; first-party referrals rising WEAKLY SUPPORTED
H2: AI Overviews GA4 ITS + GSC ITS around March 2025 NOT PRIMARY CAUSE
H3: General AI Shift Trend break + multi-factor evidence MOST PLAUSIBLE

Limitations

  • GSC provides ~16 months of history; the AI Overviews test is limited to late-2024 onward.
  • ITS detects timing alignment and slope changes, not definitive causality.
  • LLM referrals are still a small share of total traffic; substitution may be partial.

9. External Evidence: Industry Data

To validate our findings, we examined whether broader industry data supports or contradicts the observed decline pattern. Each claim below is supported by at least two independent sources.

SUPPORTING EVIDENCE

Global Publisher Traffic Down 33%

Chartbeat data shows Google search traffic to publishers declined 33% globally (38% in the US) from November 2024 to November 2025. This aligns with our finding of -35% from peak.

Sources: Press Gazette, Editor & Publisher

AI Overviews Reduce Clicks by 46-61%

Pew Research Center found users clicked on results only 8% of the time when AI summaries appeared vs 15% without them (46% reduction). Seer Interactive reported a 61% drop in organic CTR for AI Overview queries.

Sources: Pew Research Center, Search Engine Land

Zero-Click Searches: 60% (Up from 58%)

SparkToro/Similarweb data shows 60% of Google searches now end without any click to a website. For news queries, zero-click searches rose from 56% to 69% between May 2024 and May 2025.

Sources: SparkToro, The Digital Bloom

Major Sites Hit Hard: HubSpot -80%, Forbes -53%, CNN -38%

Even market leaders experienced severe declines. HubSpot lost 70-80% of organic traffic. Forbes dropped 53% YoY. CNN declined 38% YoY. Business Insider fell 55% since 2022.

Sources: Search Engine Land, Taktical, Press Gazette

73% of B2B Sites Lost Traffic

Analysis reveals that 73% of B2B websites experienced significant traffic loss between 2024 and 2025, with the average decline reaching 34% YoY - remarkably close to our observed -31% median.

Sources: KEO Marketing, The Digital Bloom

Publishers Expect 43% More Losses

Media executives surveyed expect an additional 43% decline in search traffic over the next three years. NPR called it an "extinction-level event" for online publishers.

Sources: Search Engine Land, NPR

CONTRADICTING EVIDENCE

Graphite/Similarweb: Only -2.5% Overall Decline

A study analyzing 40,000+ websites found organic traffic from Google decreased only 2.5% YoY - far less severe than Chartbeat's -33% for publishers. This suggests the decline may be sector-specific rather than universal.

Sources: Grow and Convert, Marketing4eCommerce

Total Search Volume Still Growing

Google processes over 5 trillion searches annually (13+ billion daily) in 2025, up from 8.5 billion daily in 2024. Even with higher zero-click rates, the absolute number of clicks to websites may still be growing because the total search pie is larger.

Sources: TheeDigital, Neil Patel

Synthesis: The external evidence strongly supports our finding. The only genuine contradiction is the Graphite/Similarweb study showing -2.5% vs our -31%. This discrepancy likely reflects sample composition: publishers and content sites (like ours) are hit hardest, while e-commerce and transactional sites may be less affected. Our observed decline aligns closely with Chartbeat's -33% for publishers.